Jobs
Jobs get stuff done. This page explains to create and configure jobs.
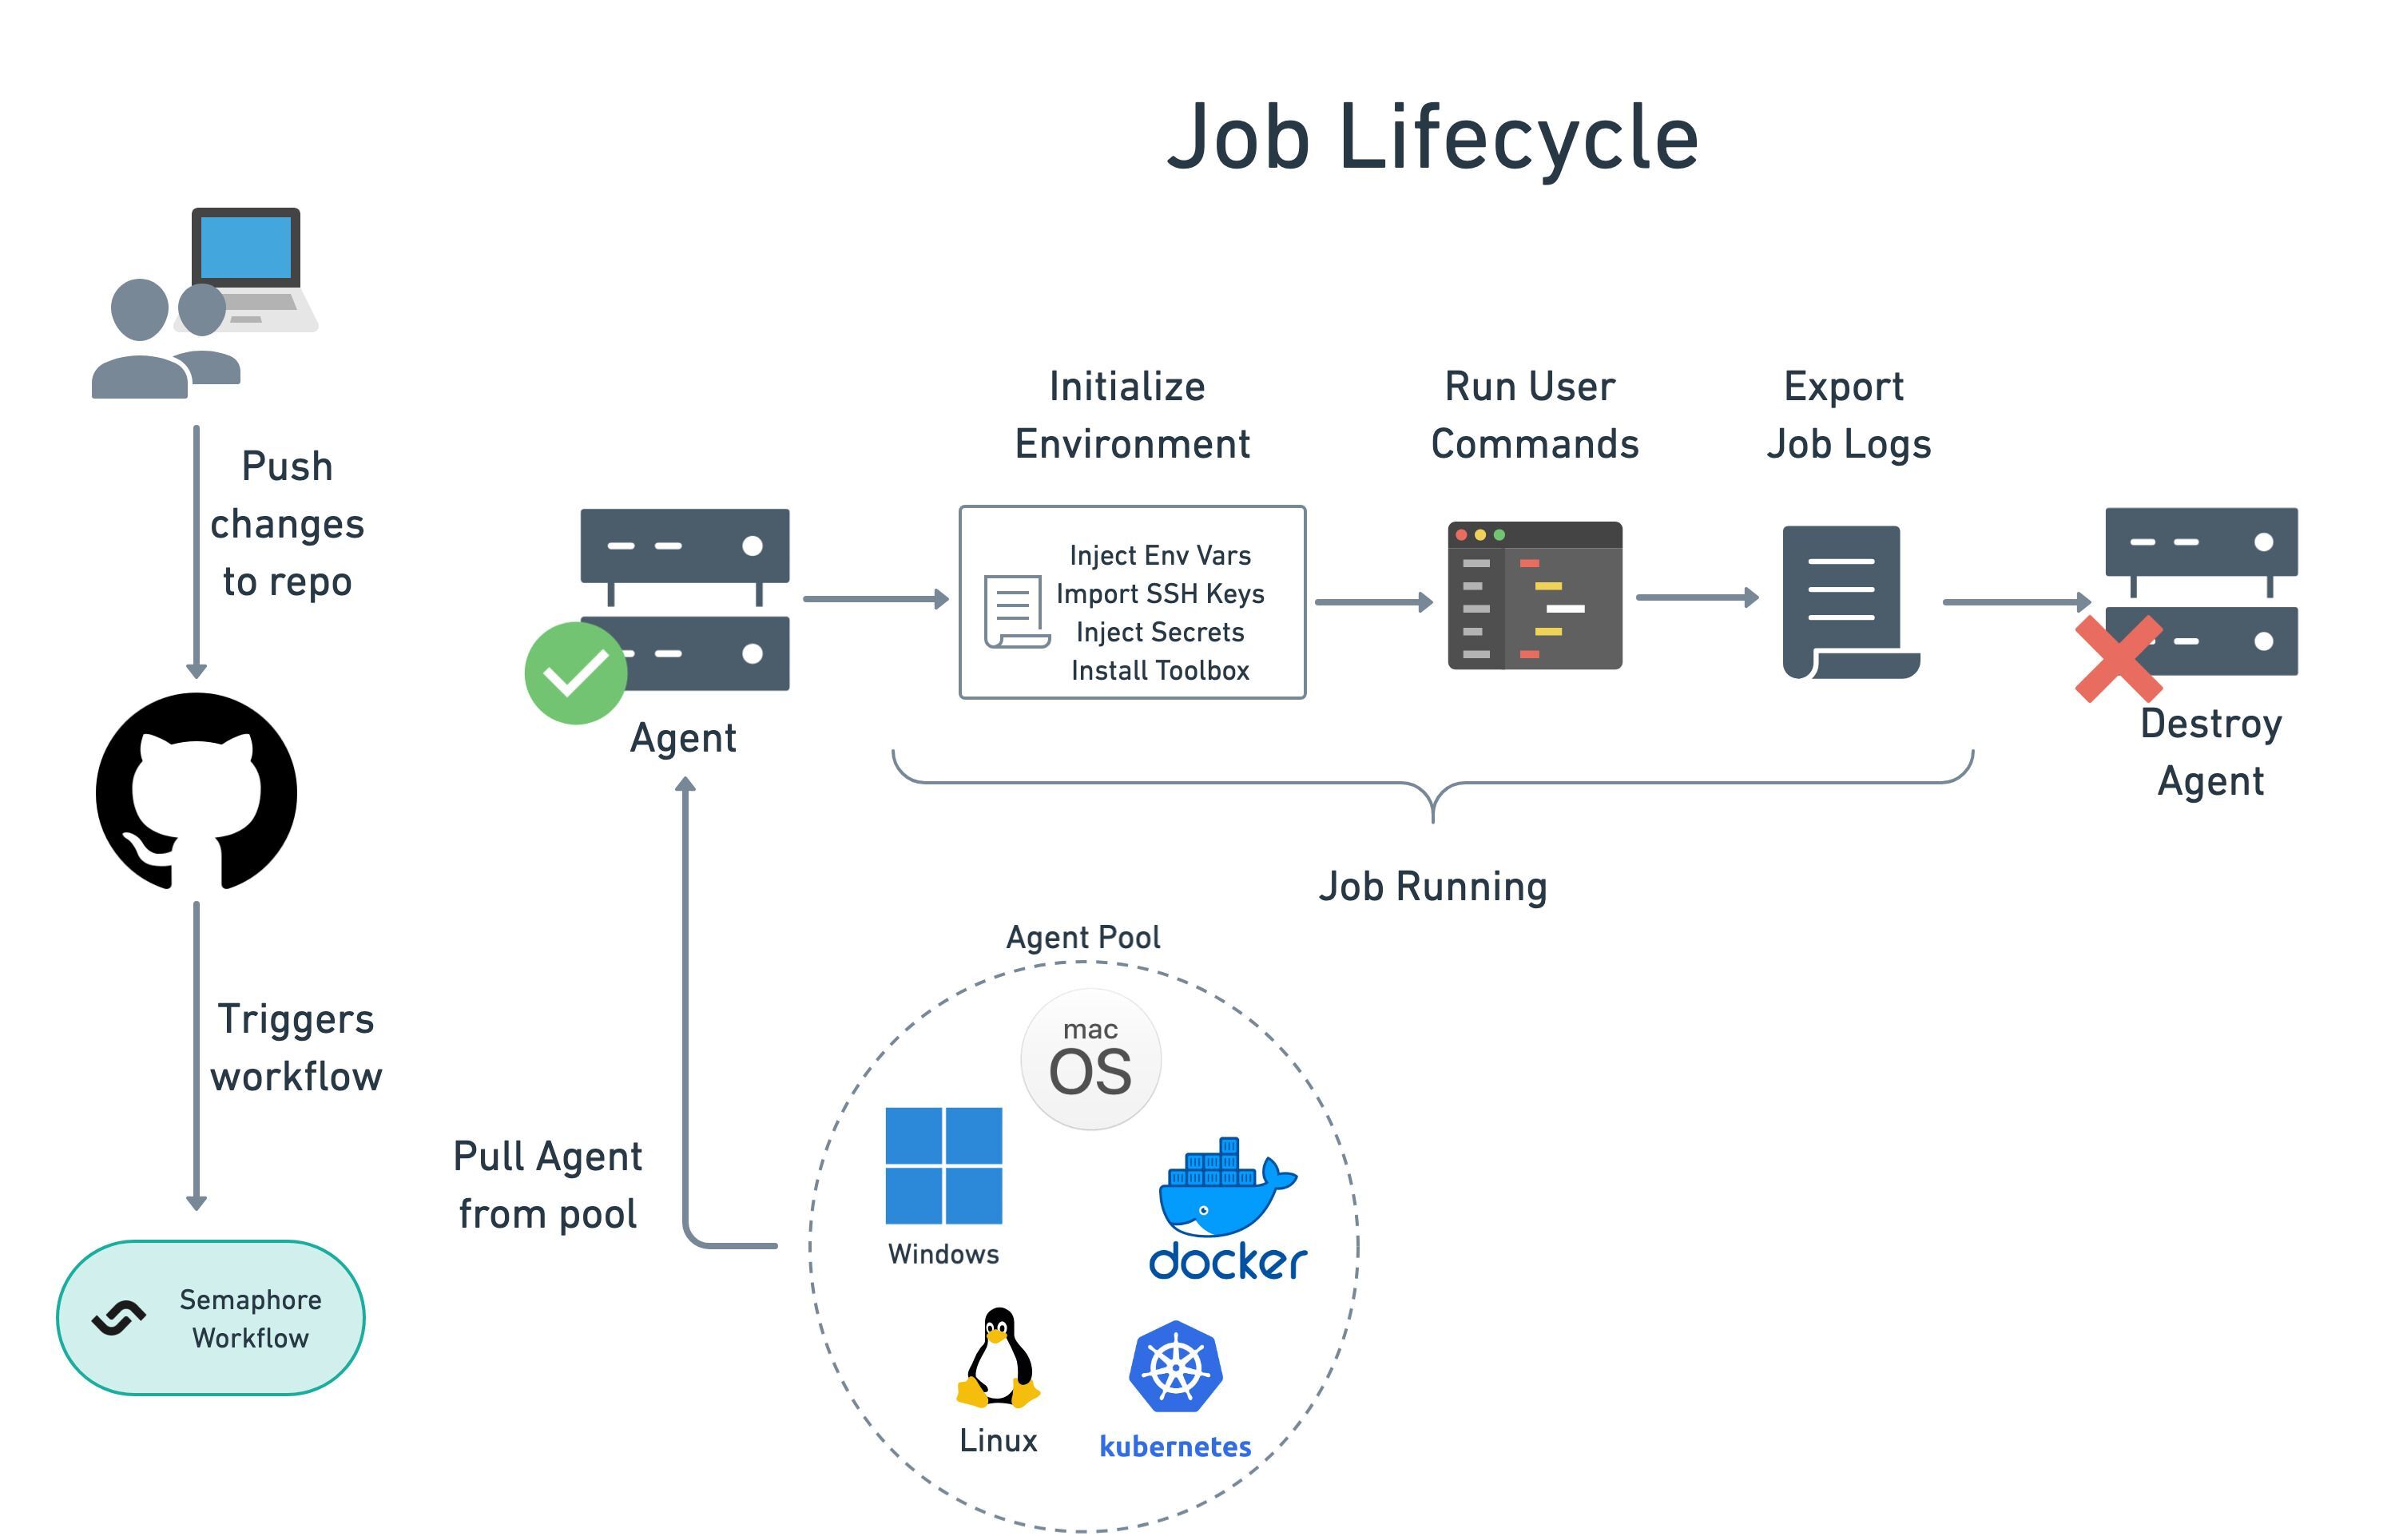
Job lifecycle
Jobs run arbitrary shell commands inside a dedicated environment called an agent. Agents can take many forms, including ephemeral Docker containers, Kubernetes pods, or x86/ARM Virtual Machines.
When a job is scheduled, the following happens:
- Allocate agent: pick a suitable agent from the pool of warm agents
- Initialize: execute setup steps such as importing environment variables, loading SSH keys, mounting secrets, and installing the Semaphore toolbox
- Run commands: execute your commands
- End job and save logs: the job activity log is saved for future inspection
- Destroy agent: the used agent is discarded along with all its contents
You can get non-ephemeral agents with self-hosted agents.
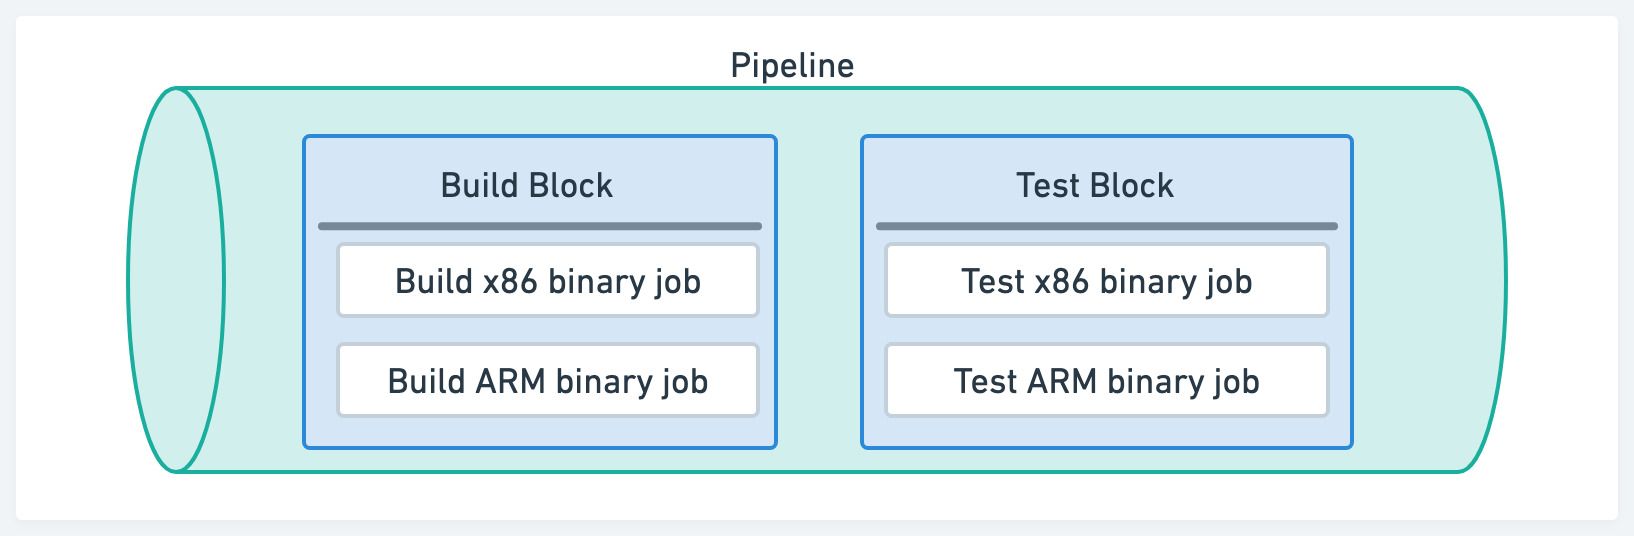
Jobs, blocks and pipelines
Semaphore uses jobs, blocks and pipelines to structure the workflow.
- Job: the minimum unit of work, a sequence of commands. Every job exists inside a block
- Block: contains one of more jobs. Jobs in the same block run concurrently and share properties
- Pipeline: a group of blocks connected by dependencies. A workflow may span multiple pipelines
How to create a job
You can create a job with the visual editor or by creating a YAML file.
- Editor
- YAML
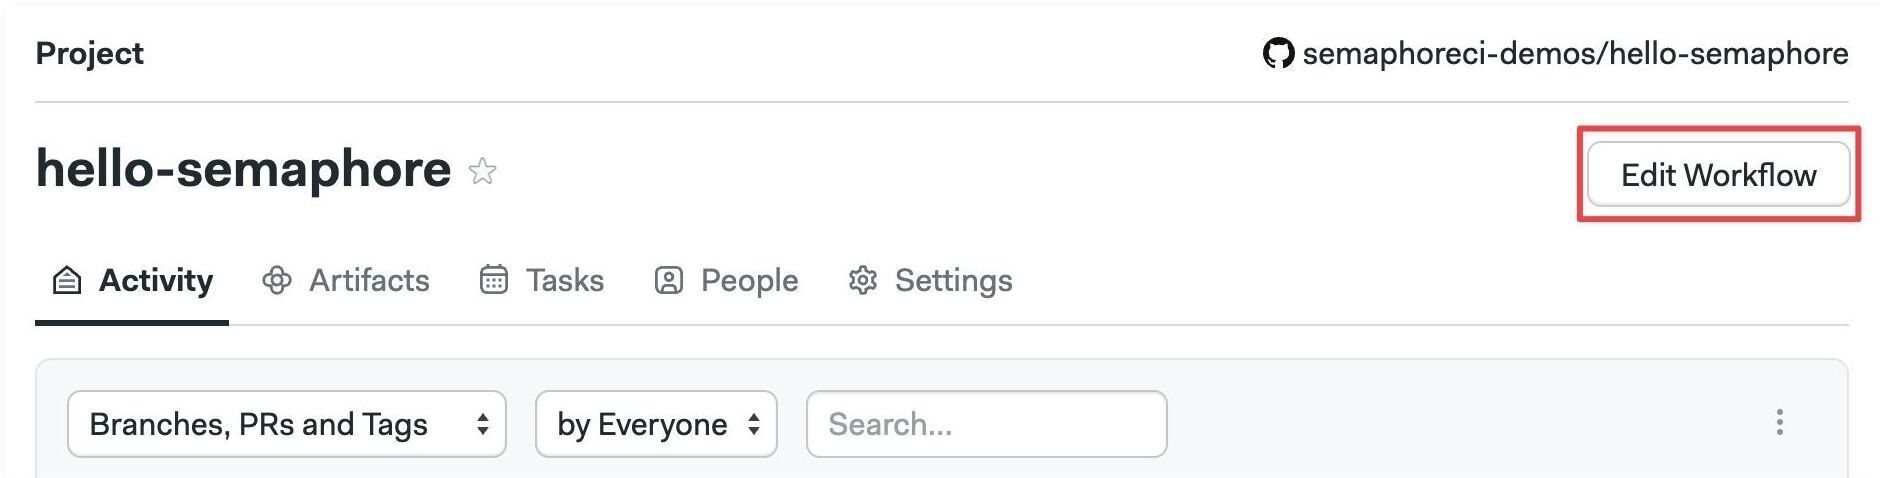
Open your project on Semaphore and press Edit Workflow.
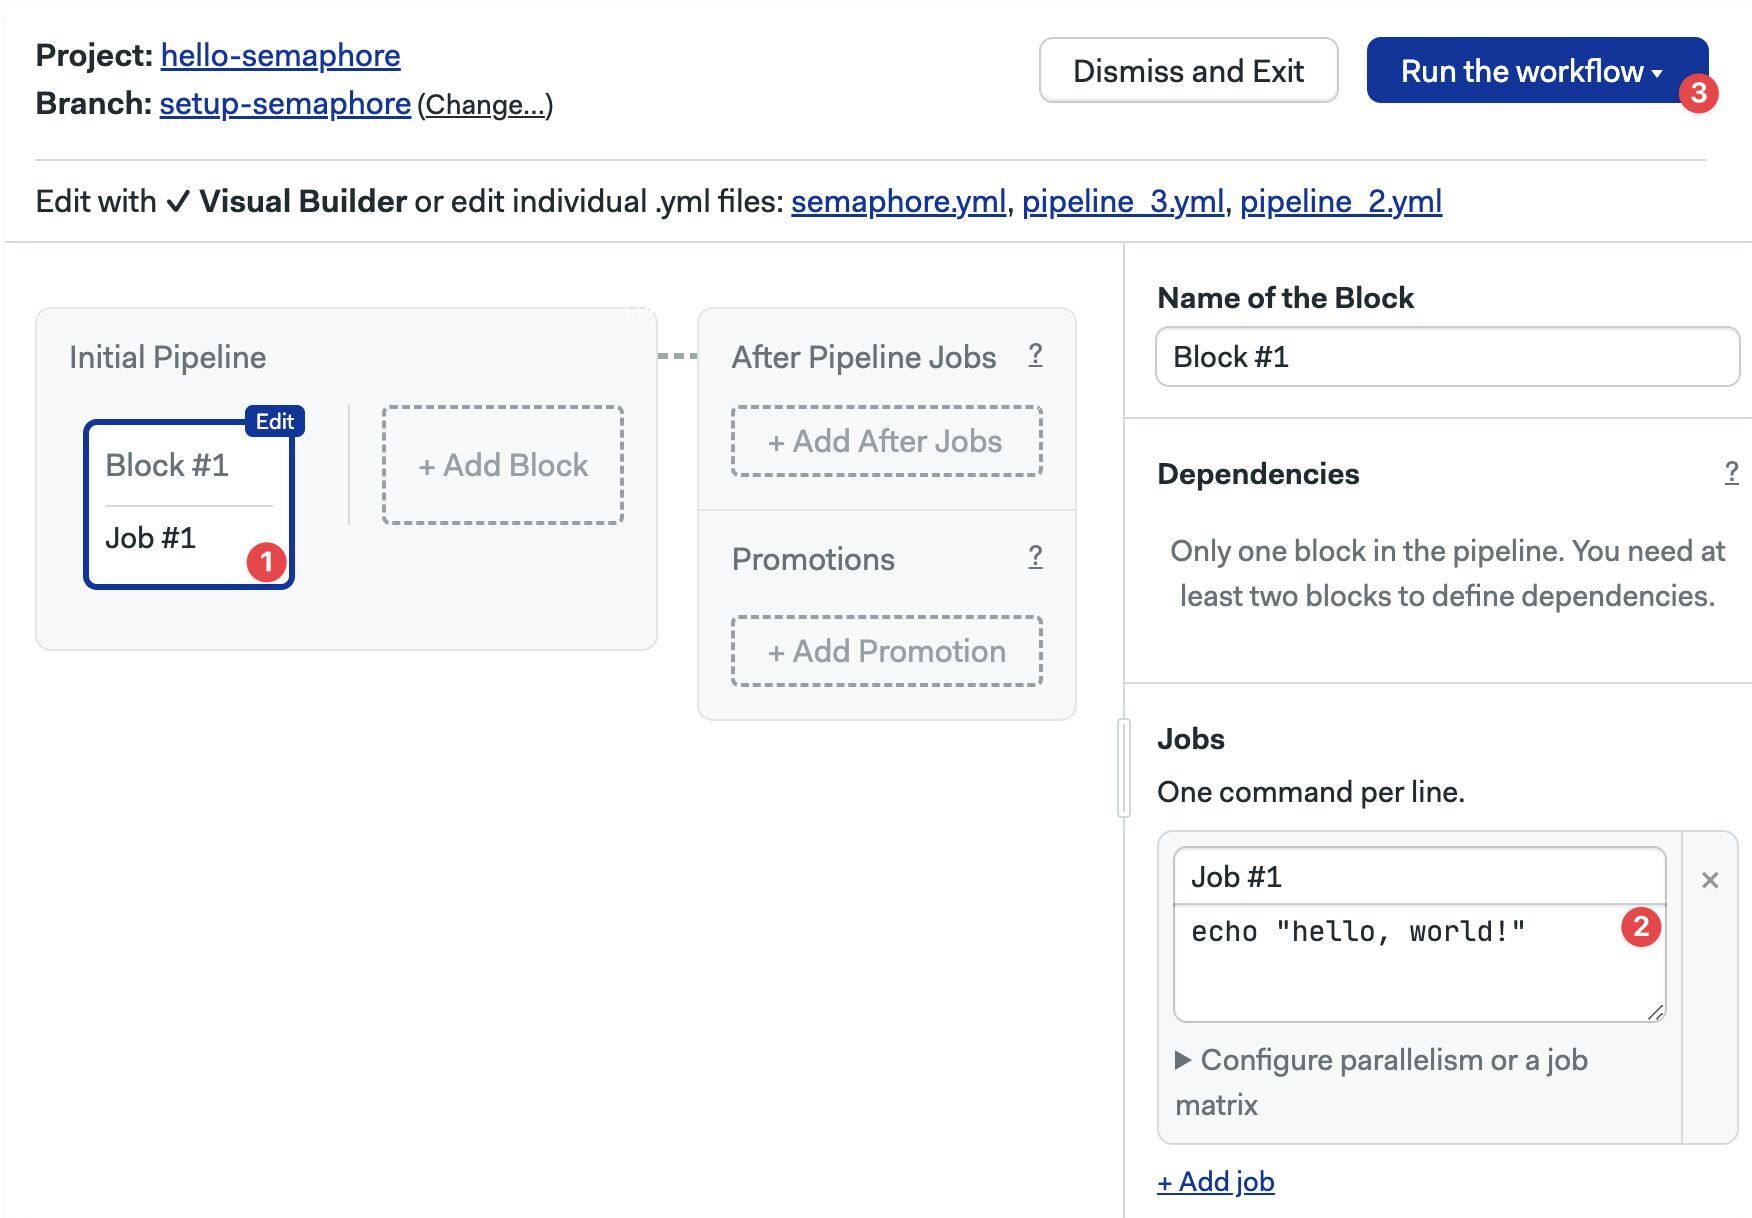
- Select the first block
- Type your shell commands
- Press Run the workflow, then press Looks good, Start →
- Create a file called
.semaphore/semaphore.ymlat the repository's root - Add the pipeline
name - Define an agent
- Create a
blockskey and type the block'sname - Add a
task.jobskey. The value is a list of jobs - Type the job's
name - Add the job's
commands. The value is a list of shell commands (one line per list item) - Save the file, commit and push it to your remote repository
You can use the following code as a starting point:
version: v1.0
name: Initial Pipeline
agent:
  machine:
    type: e1-standard-2
    os_image: ubuntu2004
blocks:
  - name: 'Block #1'
    dependencies: []
    task:
      jobs:
        - name: 'Job #1'
          commands:
            - echo "hello, world!"'
            - echo "add as many commands as you like"
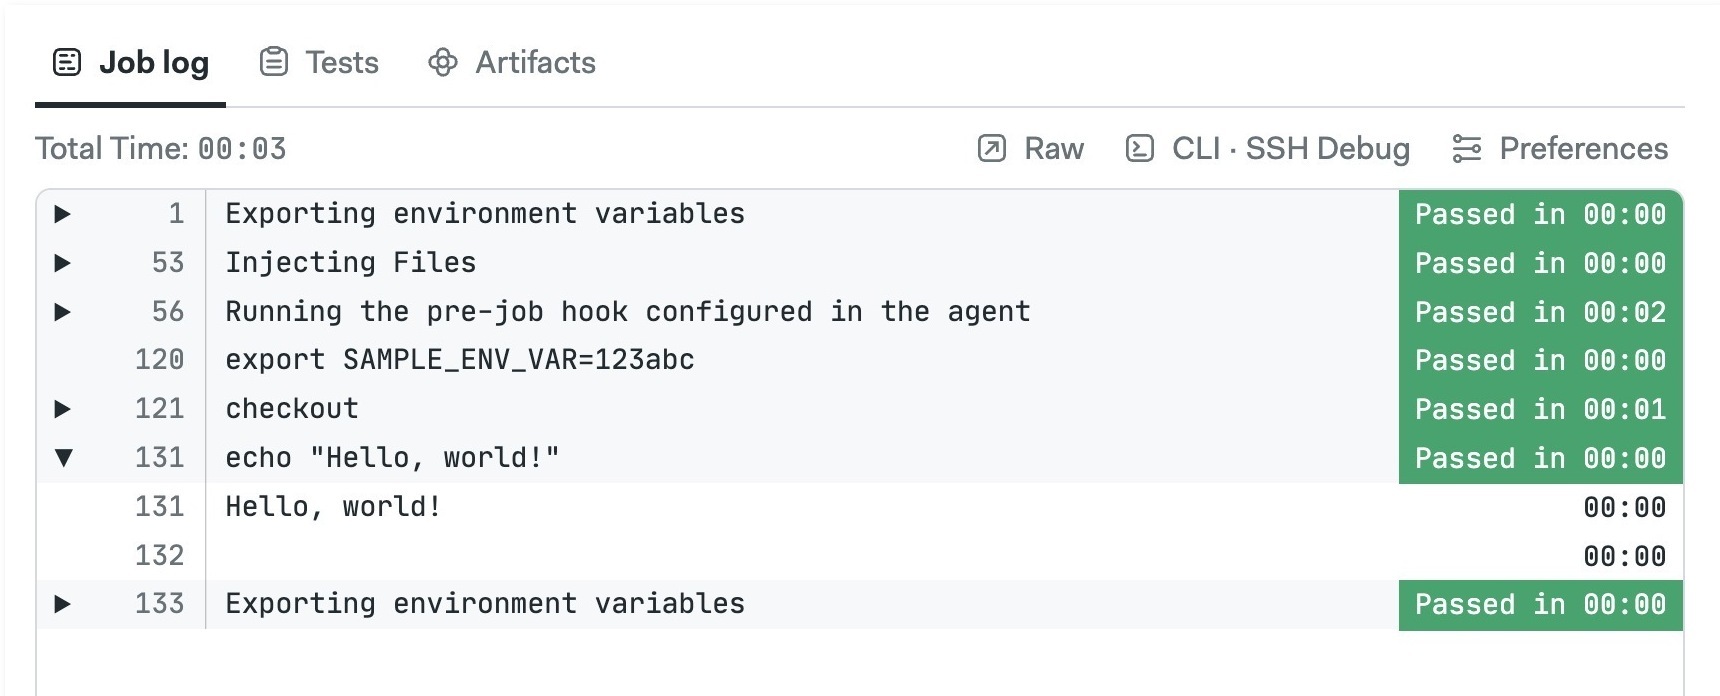
Semaphore automatically starts the job when the file is saved. Click the running job to follow the progress and view its log.
Do not use exit in the job commands. Doing so terminates the terminal session and marks the job as failed. If you want force a non-exit status code use return <int> instead.
Run jobs in parallel
Jobs in the same block always run in parallel.
- Editor
- YAML
To run two jobs in parallel:
- Select the block
- Press + Add job
- Type the job name and commands
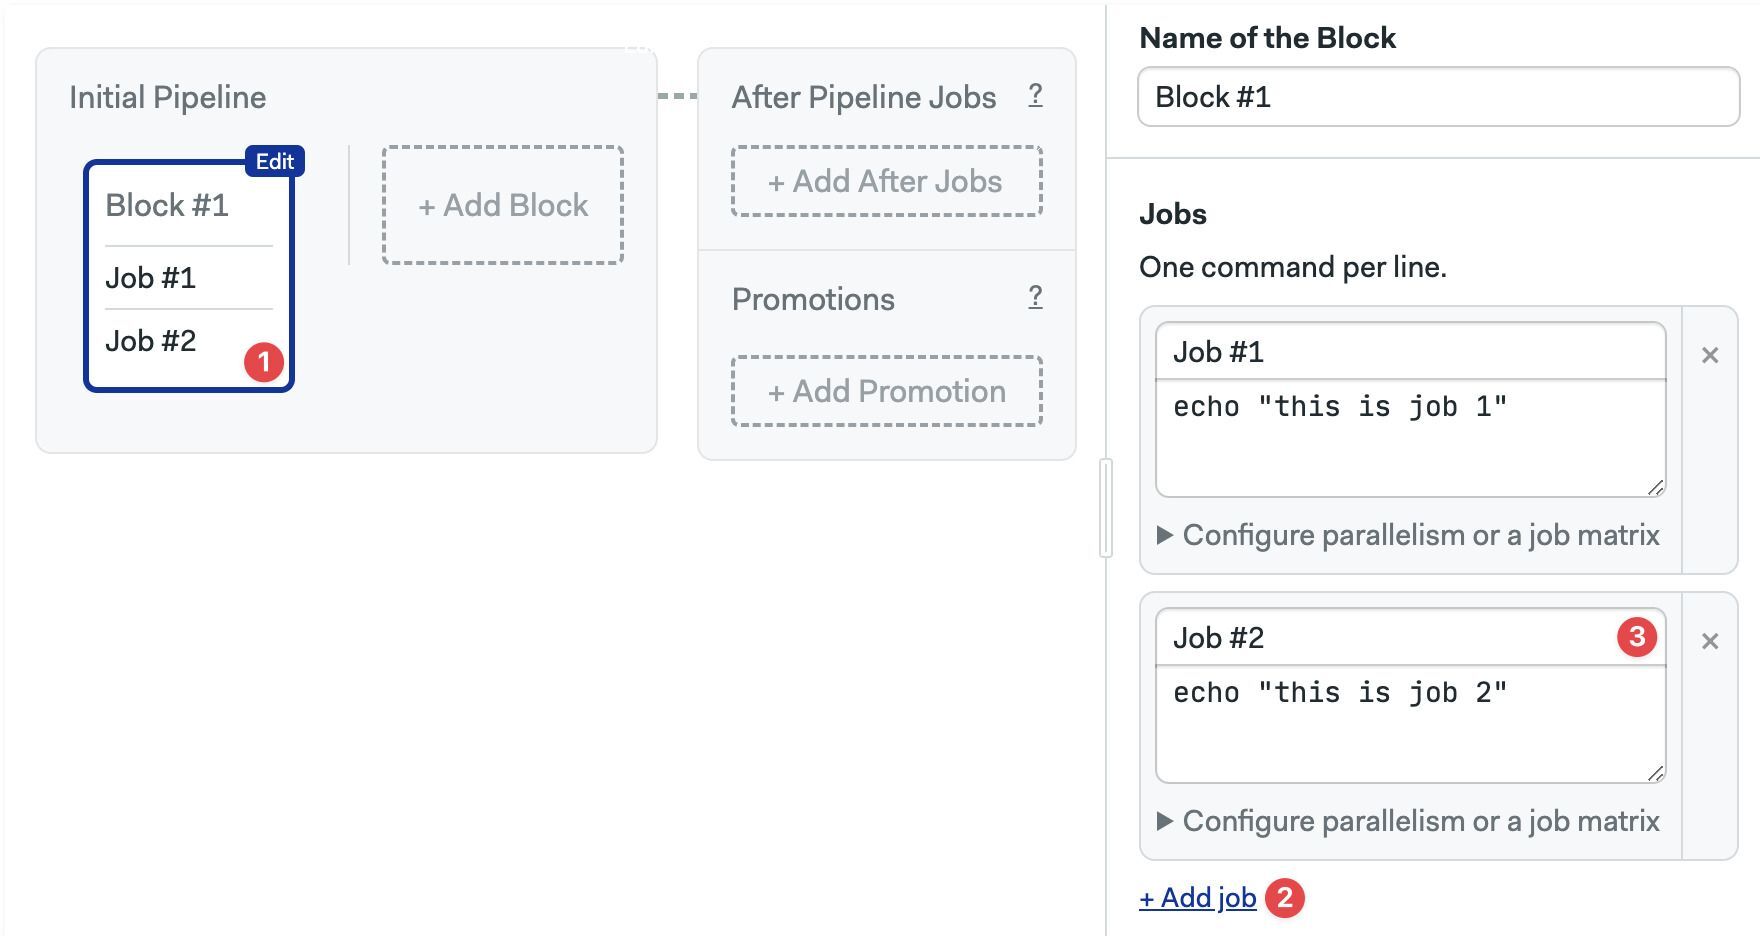
Here you can also:
- Delete a job by pressing the X sign next to it.
- Delete the whole block along with the jobs by scrolling down and clicking on Delete block...
- Add a new
nameitem underjobs - Add your shell commands (one per line) under
commands - Save the file, commit and push it to your repository
version: v1.0
name: Initial Pipeline
agent:
  machine:
    type: e1-standard-2
    os_image: ubuntu2004
blocks:
  - name: 'Block #1'
    dependencies: []
    task:
      jobs:
        - name: 'Job #1'
          commands:
            - echo "this is job 1"
        - name: 'Job #2'
          commands:
            - echo "this is job 2"
You can't share files between jobs living in the same block.
Run jobs in sequence
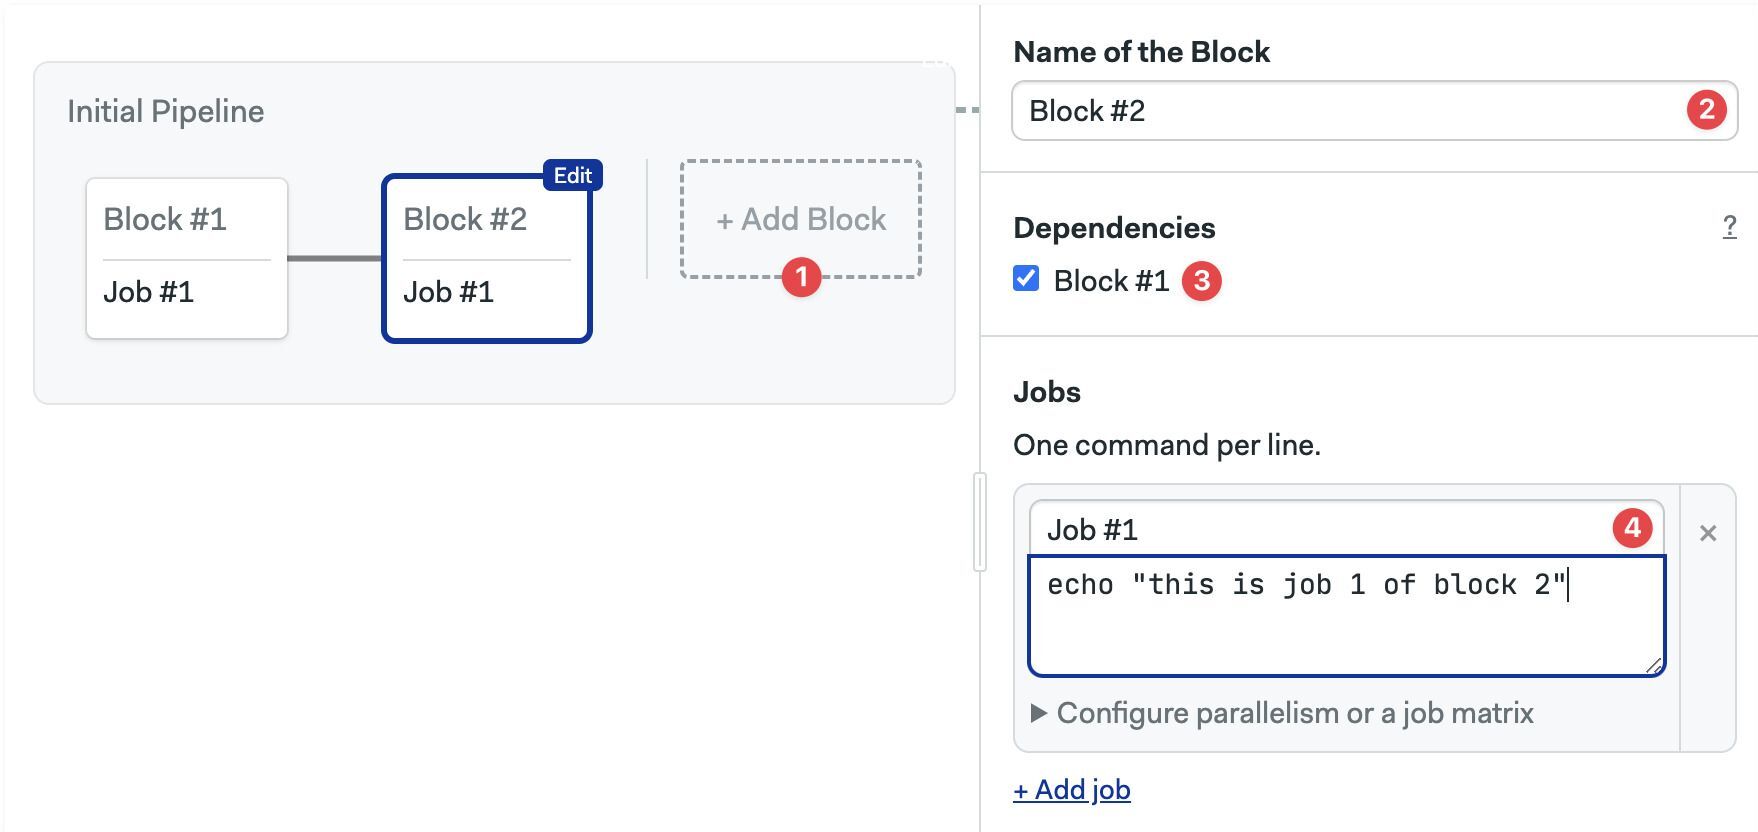
If you want to run jobs in sequence, i.e. not in parallel, you must define them in separate blocks.
- Editor
- YAML
- Click on +Add Block
- Type the name of the block
- Adjust dependencies to define execution order
- Type the name and commands for the job
- Add a new job entry under
blocks - Add a
dependencies. List the names of the dependent blocks.
version: v1.0
name: Initial Pipeline
agent:
  machine:
    type: e1-standard-2
    os_image: ubuntu2004
blocks:
  - name: 'Block #1'
    dependencies: []
    task:
      jobs:
        - name: 'Job #1'
          commands:
            - echo "this is job 1 of block 1"
  - name: 'Block #2'
    dependencies:
      - 'Block #1'
    task:
      jobs:
        - name: 'Job #1'
          commands:
            - echo "this is job 1 of block 2"
Using dependencies
You can use block dependencies to control the execution flow of the workflow. See block dependencies to learn more.
Semaphore toolbox
The Semaphore toolbox is a set of built-in command line tools to carry essential tasks in your jobs such as cloning the repository or moving data between jobs.
The most-used tools in the Semaphore toolbox are:
- checkout clones the remote Git repository
- cache speeds up jobs by caching downloaded files
- artifact saves and moves files between jobs
- sem-version changes the active version for a language or runtime
- sem-service starts database and services for testing
checkout
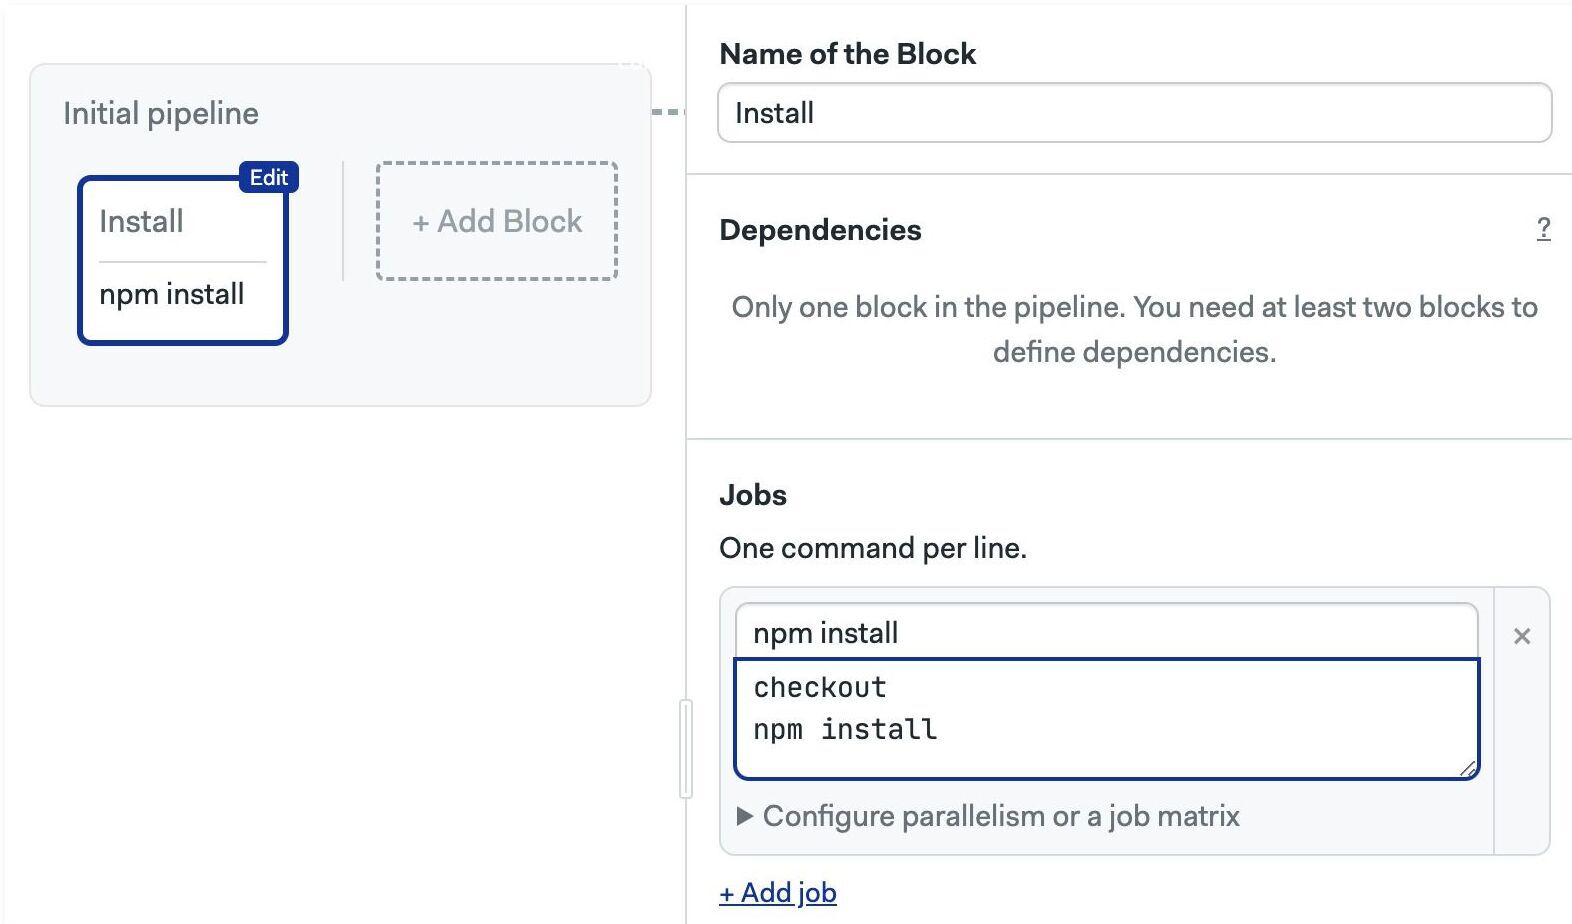
The checkout command clones the remote Git repository and cds into the repository directory so you're ready to work.
The following example shows the first commands for working with a Node.js project. We run checkout to get a local copy of the code. Next, we can run npm install because we can assume that package.json and package-lock.json exist in the current directory.
checkout
npm install
Here is how the same code looks in a Semaphore job.
- Editor
- YAML
version: v1.0
name: Initial Pipeline
agent:
  machine:
    type: e1-standard-2
    os_image: ubuntu2004
blocks:
  - name: Install
    dependencies: []
    task:
      jobs:
        - name: npm install
          commands:
            - checkout
            - npm install
How does checkout work?
Semaphore defines four environment variables to control how checkout works:
SEMAPHORE_GIT_URL: the URL of the repository (e.g. git@github.com:mycompany/myproject.git).SEMAPHORE_GIT_DIR: the path where the repository is to be cloned (e.g./home/semaphore/myproject)SEMAPHORE_GIT_SHA: the SHA key for the HEAD used forgit reset -q --hardSEMAPHORE_GIT_DEPTH: checkout does by default a shallow clone. This is the depth level for the shallow clone. Defaults to 50
cache
Using cache in self-hosted agents requires additional setup steps.
The main function of the cache is to speed up job execution by caching downloaded files.
The cache store and cache restore commands can detect well-known dependency managers and persist files automatically. Let's say we want to speed up npm install, here is how to do it:
checkout
cache restore
npm install
cache store
The highlighted lines show how to use the cache:
- cache store: saves
node_modulesto non-ephemeral storage. It knows it's a Node project because it foundpackage.jsonin the working folderx. - cache restore: retrieves the cached copy of
node_modulesto the working directoryx.
Cache is not limited to Node.js. It works with several languages and frameworks. Alternatively, you can use cache with any kind of file or folder but in that case, you need to supply additional arguments
artifact
Using artifact in self-hosted agents requires additional setup steps.
The artifact command can be used:
- as a way to move files between jobs and runs
- as persistent storage for artifacts like compiled binaries or bundles
The following example shows how to persist files between jobs. In the first job we have:
checkout
npm run build
artifact push workflow dist
In the following jobs, we can access the content of the dist folder with:
artifact pull workflow dist
Let's do another example: this time we want to save the compiled binary hello.exe:
checkout
go build
artifact push project hello.exe
Artifact namespaces
Semaphore uses three separate namespaces of artifacts: job, workflow, and project. The syntax is:
artifact <pull|push> <job|workflow|project> </path/to/file/or/folder>
The namespace used controls at what level the artifact is accessible:
- job artifacts are only accessible to the job that created it. Useful for collecting debugging data
- workflow artifacts are accessible to all jobs in all running pipelines. The main use case is to pass data between jobs.
- project artifacts are always accessible. They are ideal for storing final deliverables.
For more information, see the Semaphore toolbox documentation.
sem-version
The sem-version is a Linux utility to change the active language or runtime.
The syntax is:
sem-version <target> <version>
For example, to use Node.js version v20.9.0:
sem-version node 20.9.0
node --version
checkout
npm install
npm test
See the toolbox to view all languages supported by this tool.
See languages for language-specific guidance.
If the language you need is not available in the pre-built images, you can still any language version with Docker Environments.
sem-service
The sem-service utility is used to start and stop databases and other popular services.
The syntax is:
sem-service <command> <service-name> <version>
For example, to start a PostgreSQL v16:
sem-service start postgres 16
checkout
npm install
npm test
You don't need to manually stop services at the end of the job. They are terminated automatically. See the toolbox to view all services supported by this tool.
Debugging jobs
Video Tutorial: Debugging tools
This section shows tips to detect and debug failing jobs.
Why my job has failed?
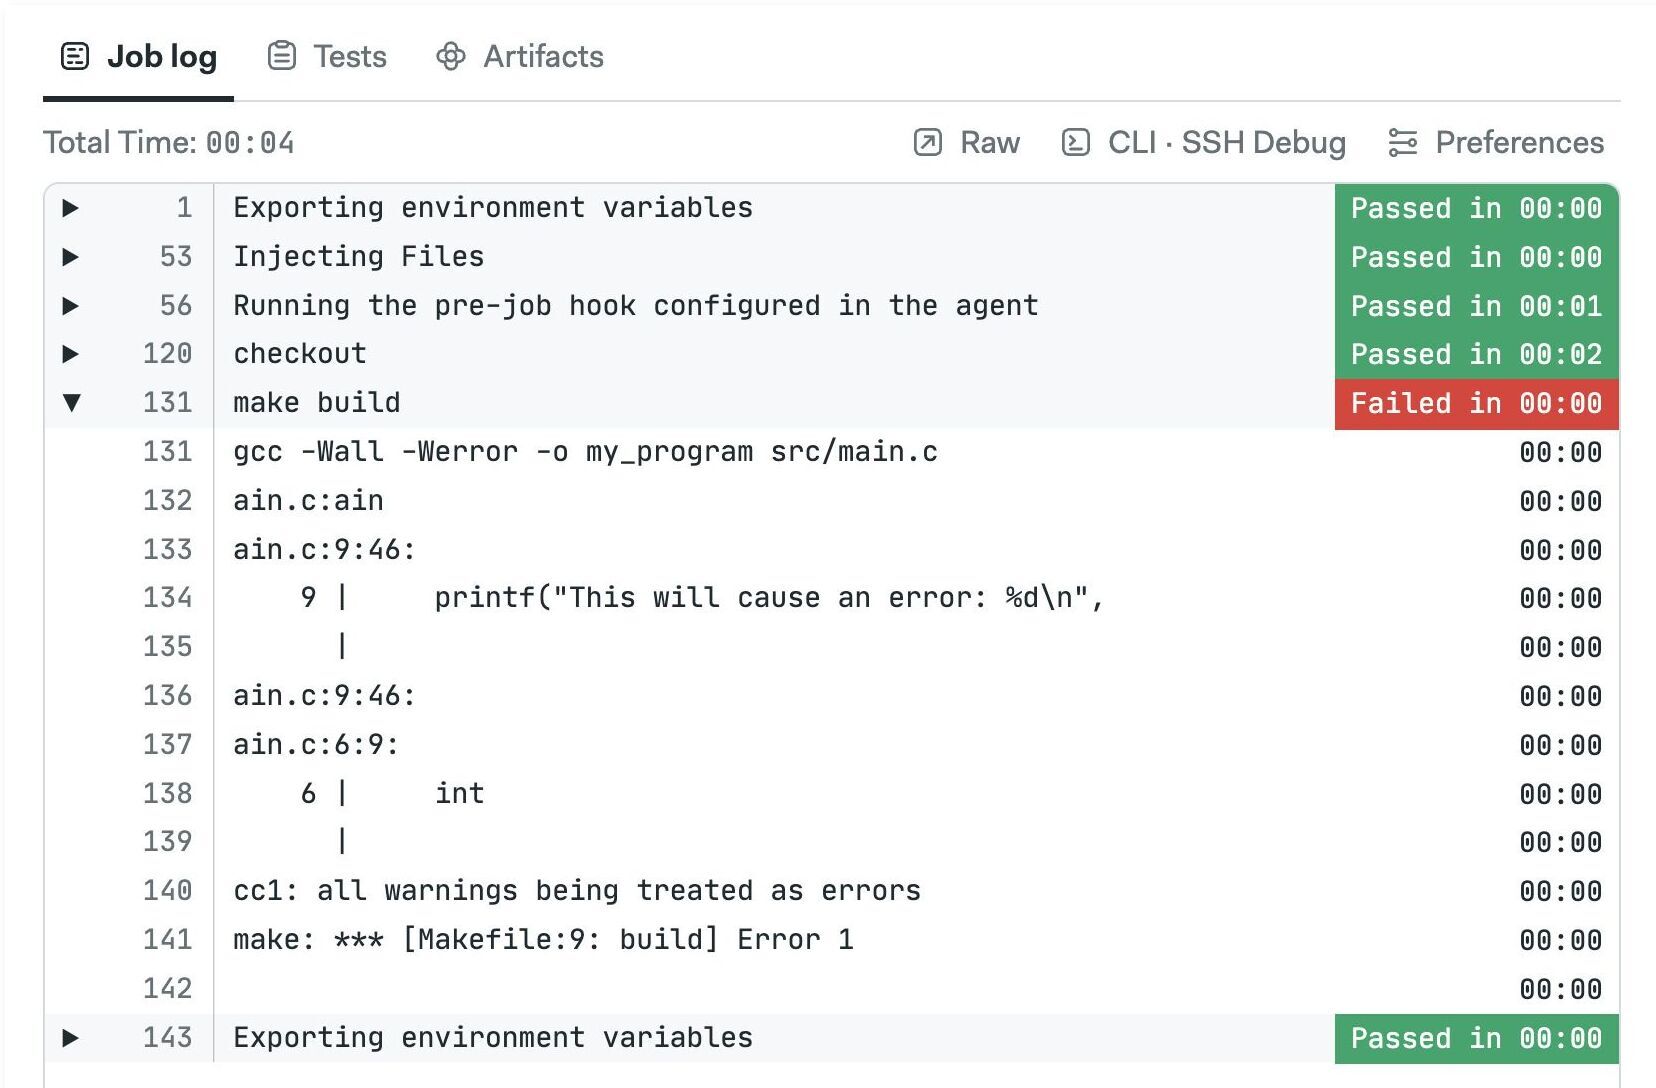
Semaphore ends the job as soon as a command ends with non-zero exit status. Once a job has failed, no new jobs will be started and the workflow is marked as failed.
Open the job log to see why it failed. The problematic command is shown in red. You can click on the commands to expand their output.
If you want to ignore the exit status of a command append || true at the end. For example:
echo "the next command might fail, that's OK, I don't care"
command_that_might_fail || true
echo "continuing job..."
Interactive debug with SSH
You can debug a job interactively by SSHing into the agent. This is a very powerful feature for troubleshooting.
If this is the first time using an interactive session you need to install and connect the Semaphore command line tool.
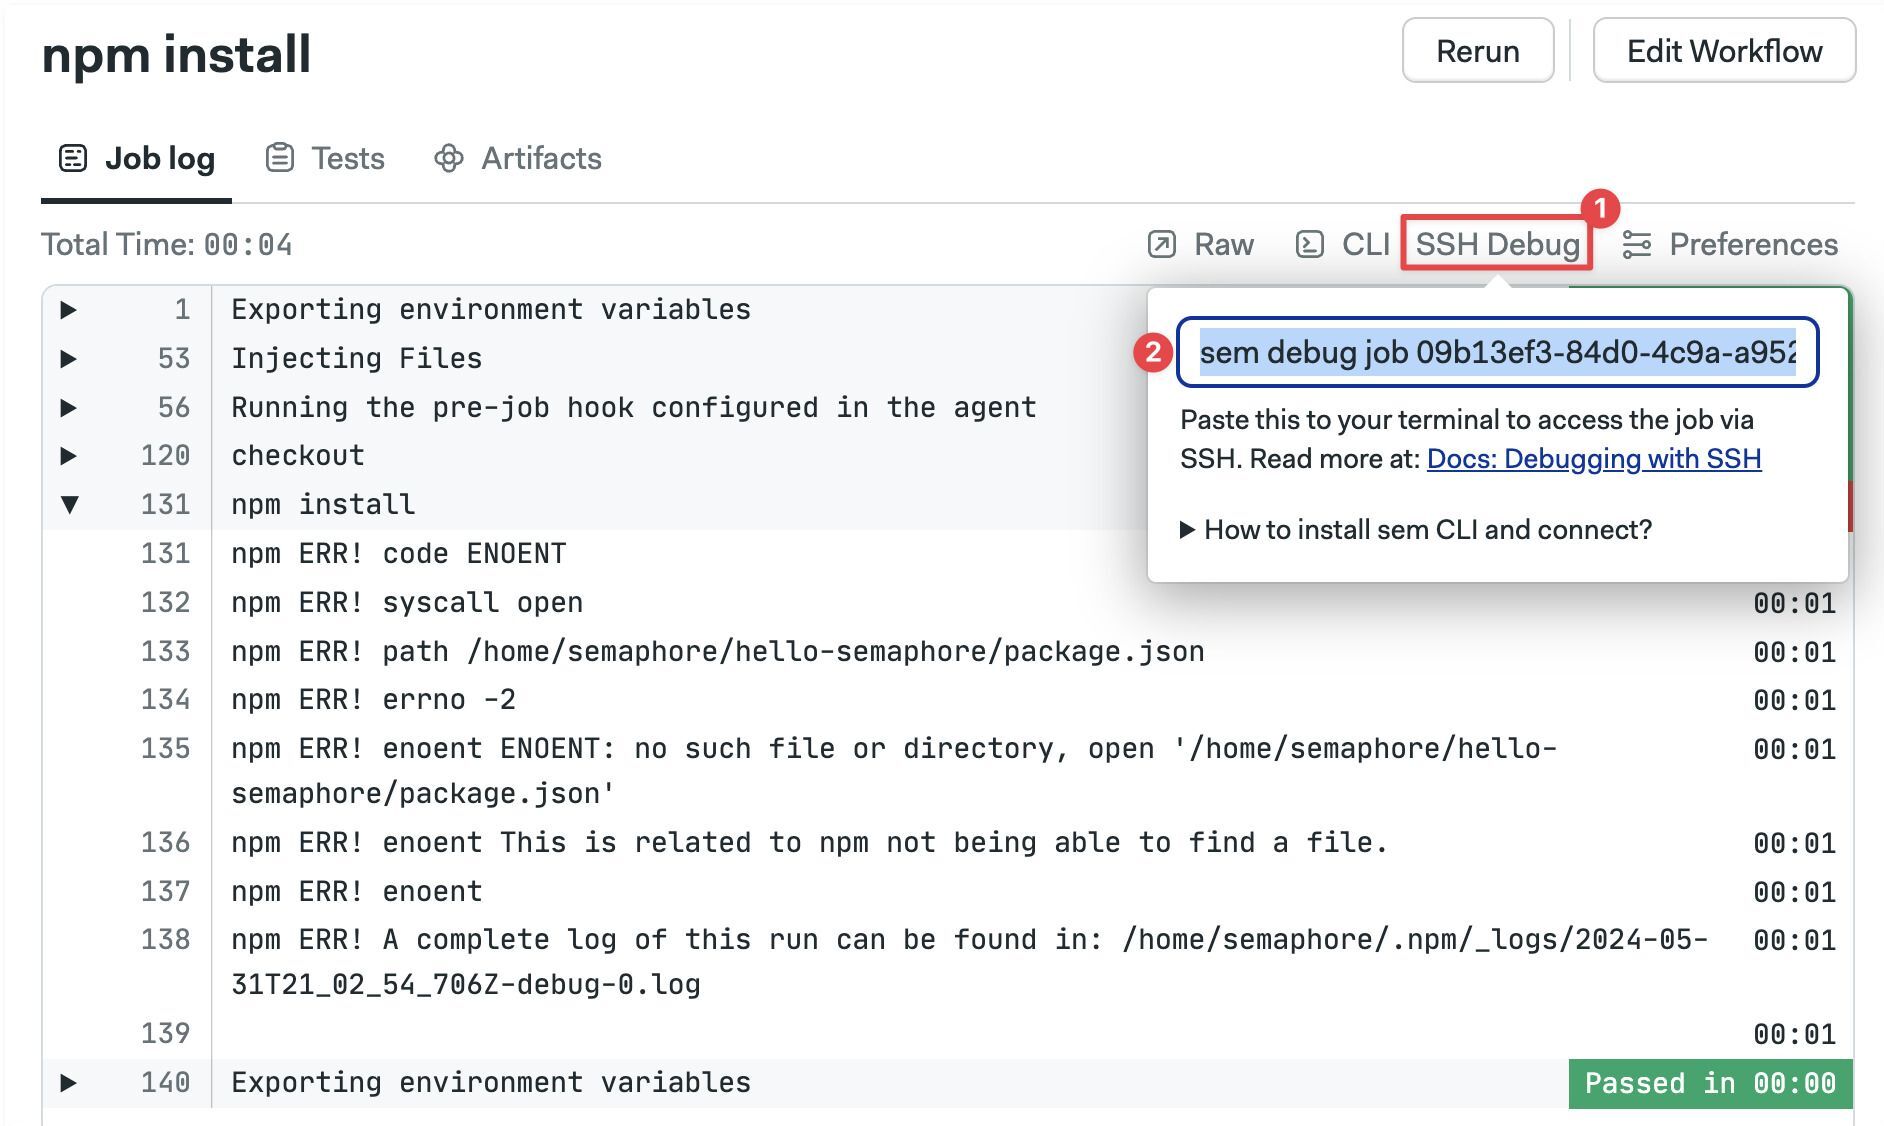
To open an interactive session, open the job log and:
- Click on SSH Debug
- Copy the command shown
- Run the command in a terminal
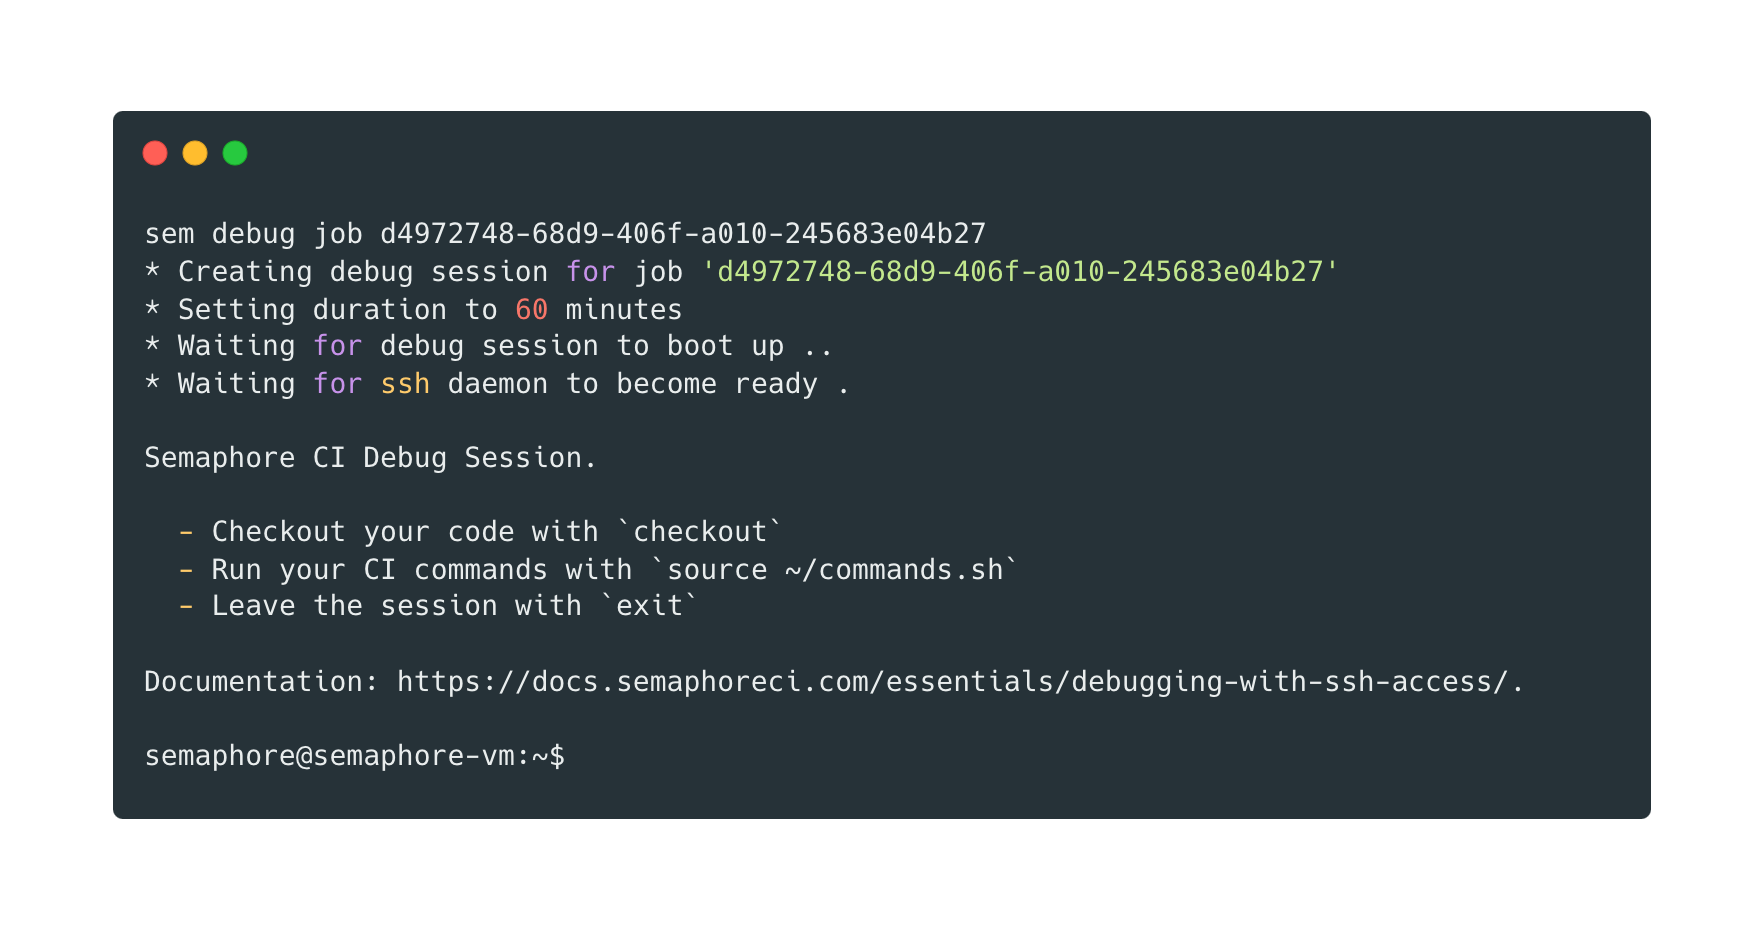
You'll be presented with a welcome message like this:
* Creating debug session for job 'd5972748-12d9-216f-a010-242683a04b27'
* Setting duration to 60 minutes
* Waiting for the debug session to boot up ...
* Waiting for ssh daemon to become ready.

Semaphore CI Debug Session.

 - Checkout your code with `checkout`
 - Run your CI commands with `source ~/commands.sh`
 - Leave the session with `exit`

Documentation: https://docs.semaphoreci.com/essentials/debugging-with-ssh-access/.

semaphore@semaphore-vm:~$
To run the actual job commands in the SSH session:
source ~/commands.sh
You can actually run anything in the agent, including commands that were not actually part of the job. Exit the session to end the job.
By default, the duration of the SSH session is limited to one hour. To run longer debug sessions, pass the duration flag to the previous command as shown below:
sem debug job <job-id> --duration 3h
- Interactive sessions may be unavailable when access policies for secrets is enabled.
- Setting Bash option
set -edisables shell autocompletion and causes the SSH session to exit with error.
Inspecting running jobs
You attach a terminal console to a running job. The steps are the same as debugging a job. The only difference is that Semaphore presents the following command (only while the job is running):
sem attach <job-id>
You can explore running processes, inspect the environment variables, and take a peek at the log files to help identify problems with your jobs.
Inspecting running jobs may be unavailable when access policies for secrets is enabled.
Port forwarding
When SSH is not enough to troubleshoot an issue, you can use port forwarding to connect to services listening to ports in the agent.
A typical use case for this feature is troubleshooting end-to-end tests. Let's say a test is failing and you can't find any obvious cause from the logs alone. Port forwarding the HTTP port in the agent to your local machine can reveal how the application "looks".
To start a port-forwarding session:
sem port-forward <job-id> <local-port> <remote-port>
For example, to forward an application listening on port 3000 in the agent to your machine on port 6000:
sem port-forward <job-id> 6000 3000
You can now connect to http://localhost:6000 to view the application running remotely in the agent.
Port-forwarding only works for Virtual Machine-based agents. It's not available in Docker environments.
Block settings
The settings you configure on the block are applied to all the contained jobs.
Prologue
Commands in the prologue run before each job in the block. Use this to run common setup commands like downloading dependencies, setting the runtime version, or starting test services.
- Editor
- YAML
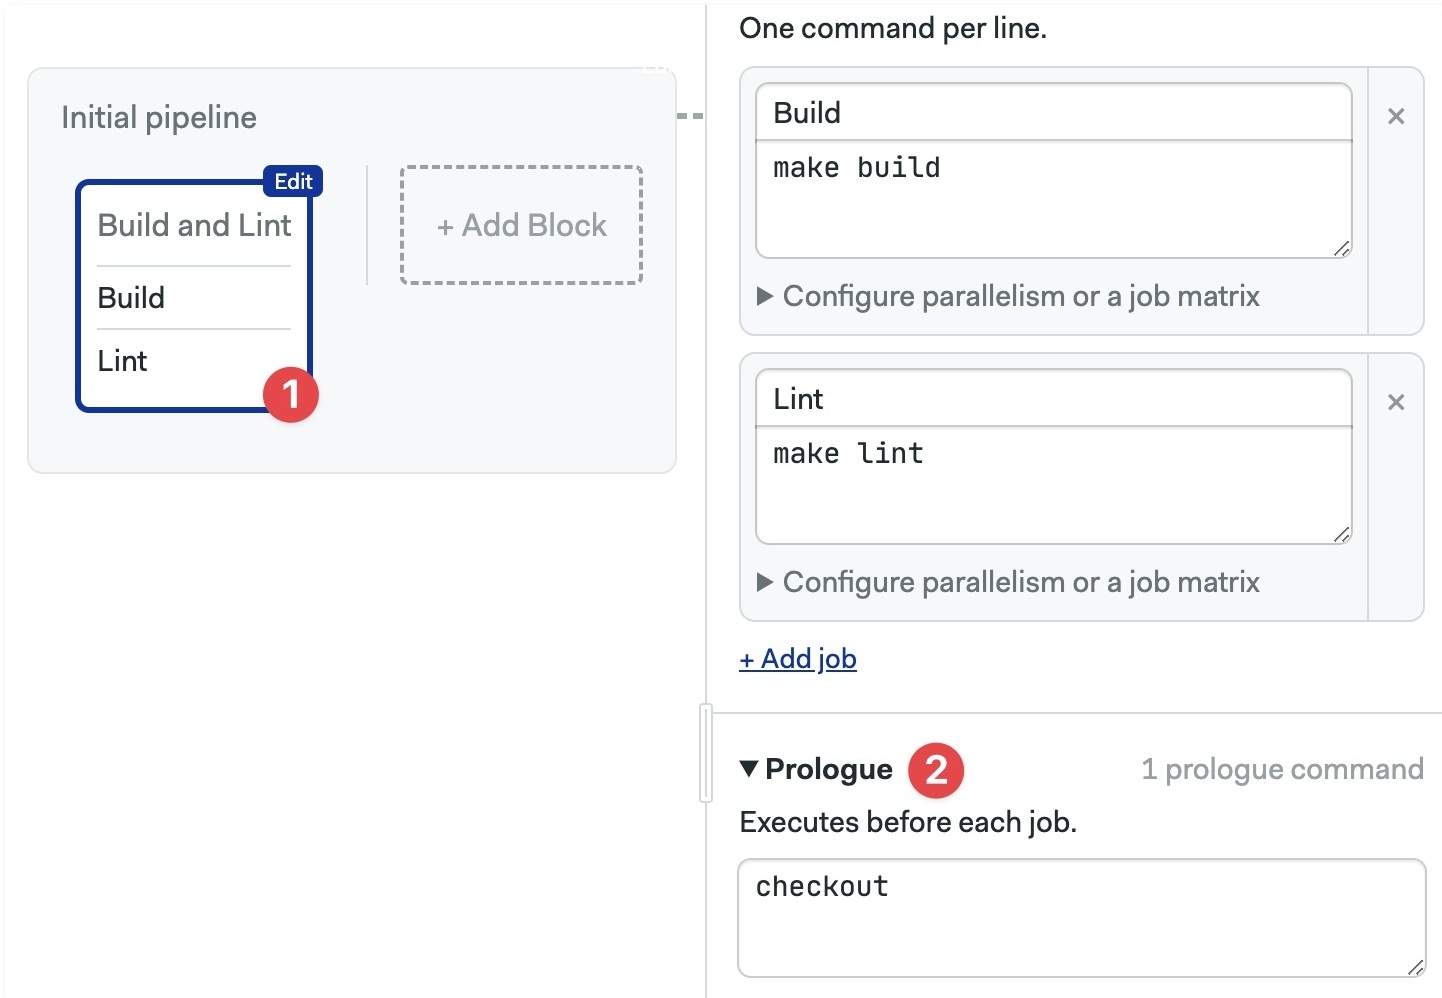
- Select the block
- Open the prologue section and add your shell commands.
In the example below we use checkout to clone the repository at the start of every job in the block.
- Locate the block you wish to add the prologue to
- Add the
prologueundertasks - The
commandsare prepended to all jobs in the block.
In the example below we use checkout to clone the repository at the start of every job in the block.
version: v1.0
name: Initial Pipeline
agent:
  machine:
    type: e1-standard-2
    os_image: ubuntu2004
blocks:
  - name: Build
    dependencies: []
    task:
      prologue:
        commands:
          - checkout
      jobs:
        - name: Build
          commands:
            - make build
        - name: Lint
          commands:
            - make lint
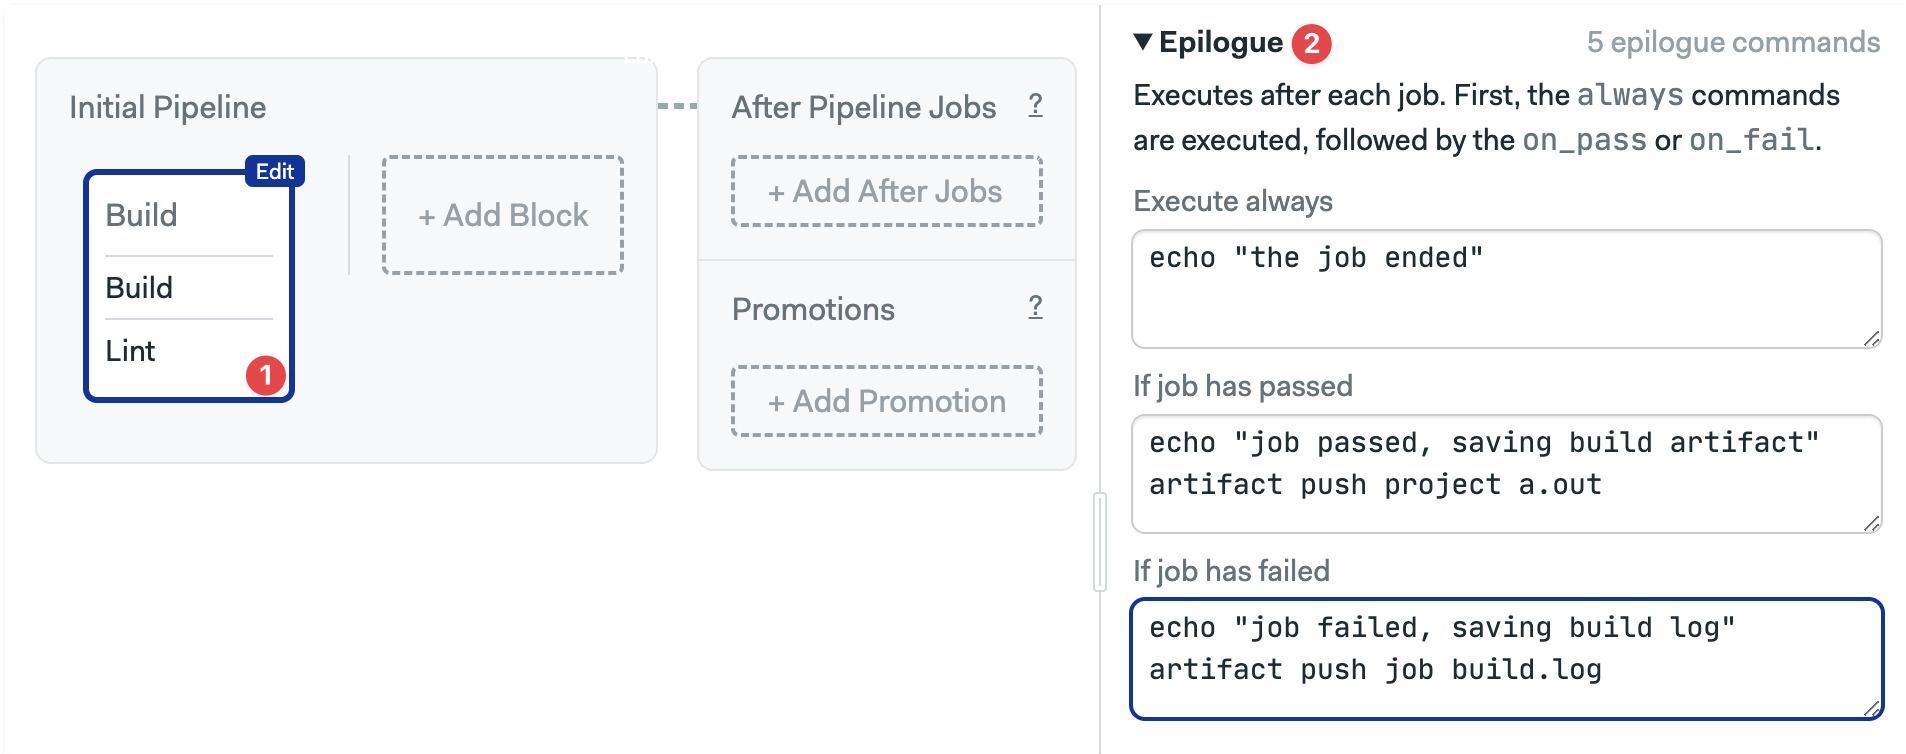
Epilogue
Commands in the epilogue are executed after each job in the job ends. There are three epilogue types:
- Execute always: always runs after the job ends, even if the job failed
- If job has passed: commands to run when the job passes (all commands exited with zero status)
- If job has failed: commands to run when the job failed (one command exited with non-zero status)
- Editor
- YAML
- Select the block
- Open the epilogue section (you may need to scroll down) and add your commands
In the example below we use artifact to save build artifacts and log files.
- Find the block where you wish to add the epilogue
- Add the
epiloguetypes you wish key undertasks
In the example below we use artifact to save build artifacts or log files.
version: v1.0
name: Initial Pipeline
agent:
  machine:
    type: e1-standard-2
    os_image: ubuntu2004
blocks:
  - name: Build
    dependencies: []
    task:
      epilogue:
        always:
          commands:
            - echo "the job ended"
        on_pass:
          commands:
            - 'echo "job passed, saving build artifact"'
            - artifact push project a.out
        on_fail:
          commands:
            - 'echo "job failed, saving build log"'
            - artifact push job build.log
      prologue:
        commands:
          - checkout
      jobs:
        - name: Build
          commands:
            - make build
        - name: Lint
          commands:
            - make lint
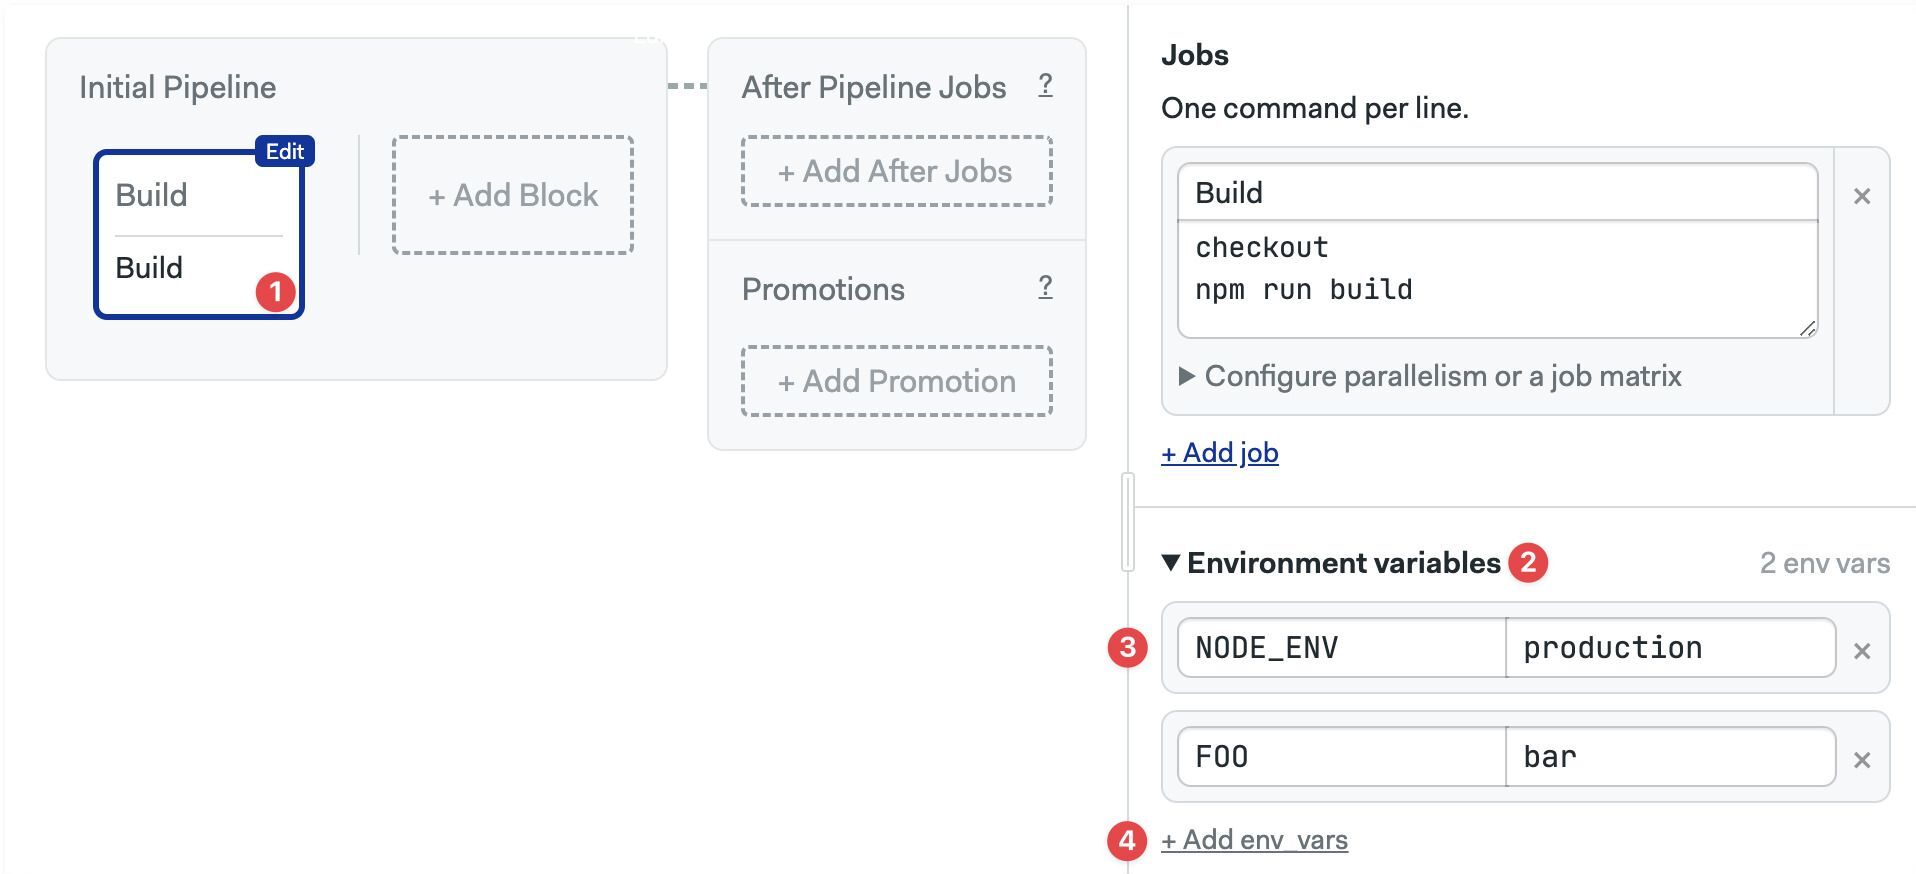
Environment variables
Video Tutorial: How to use environment variables
Environment variables are exported into the shell environment of every job in the block. You must supply the variable name and value.
- Editor
- YAML
To add an environment variable:
- Select the block
- Open the Environment Variables section (you may need to scroll down)
- Set your variable name and value
- Press +Add env vars if you need more variables
- Locate the block where you add the environment variables
- Add
env_varskey undertask - Edit the variables
nameandvalue. You can have many variables underenv_vars
version: v1.0
name: Initial Pipeline
agent:
  machine:
    type: e1-standard-2
    os_image: ubuntu2004
blocks:
  - name: Build
    dependencies: []
    task:
      env_vars:
        - name: NODE_ENV
          value: production
        - name: FOO
          value: bar
      jobs:
        - name: Build
          commands:
            - checkout
            - npm run build
Numeric values need to be included in quotes.
Environment variables or shell exports?
You can define environment variables in two ways:
- by putting them in the environment variables section
- by using
exportcommands in the job window:export NODE_ENV="production"
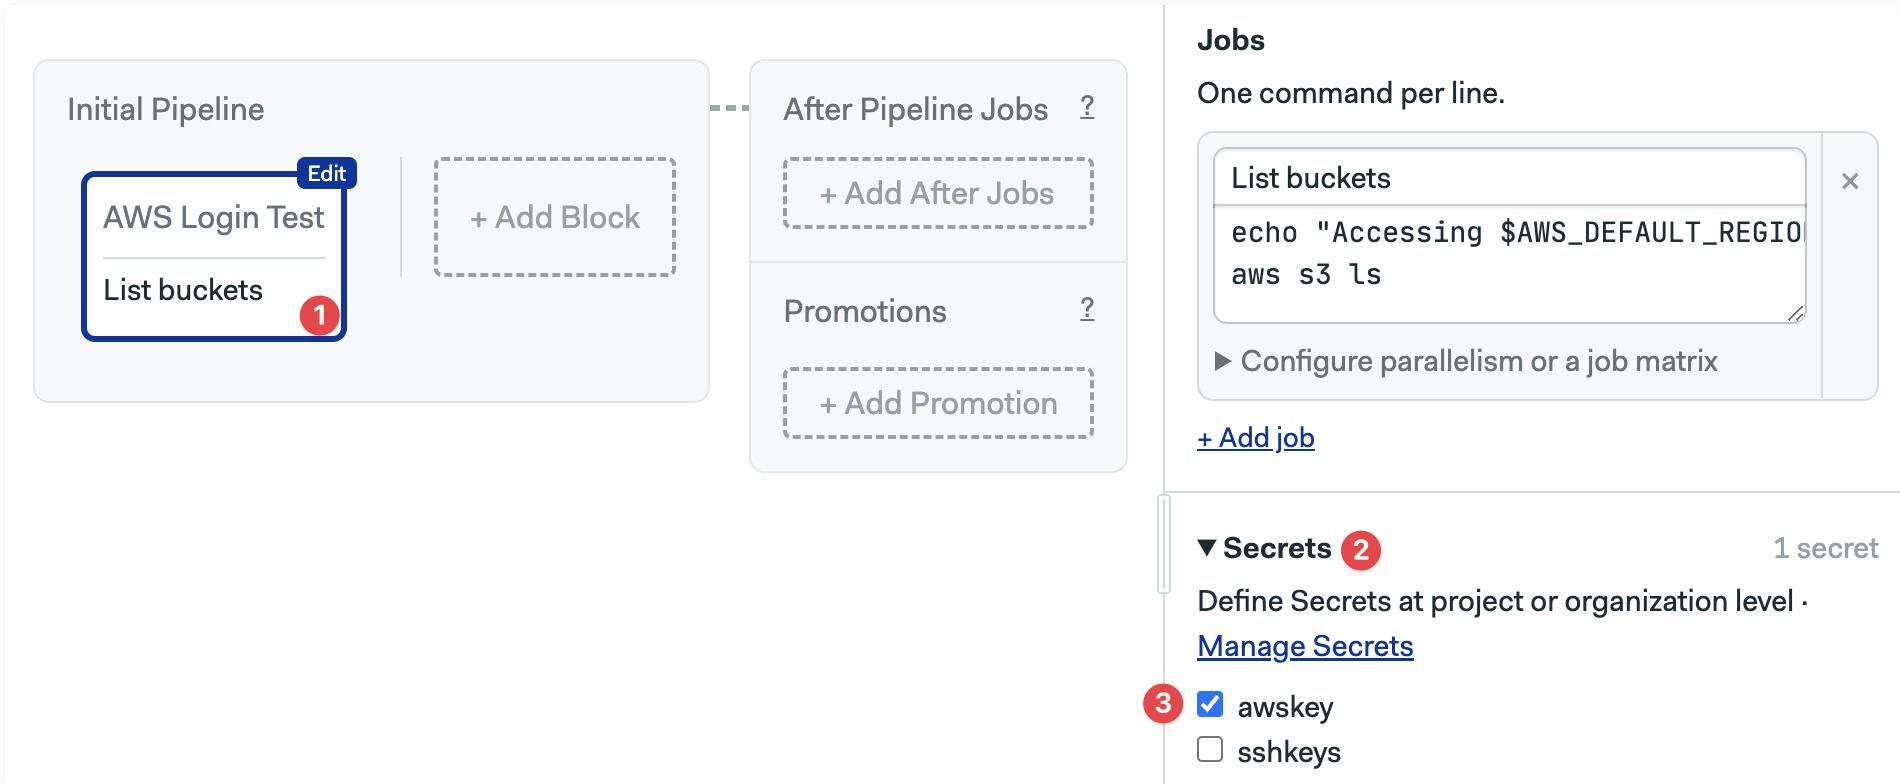
Secrets
Secrets are enabled at the block level and available to all the jobs in the block. You must create the secret before you can add it to a block.
To enable existing secrets in a block:
- Editor
- YAML
- Select the block
- Open the Secrets section (you may need to scroll down)
- Enable the checkbox next to the secret
The secret values are now available for all jobs in the block.
- Locate the block where you want to add the secrets
- Add a
secretskey undertasks - List the names of the secrets to import
The secret values are now available for all jobs in the block.
version: v1.0
name: Initial Pipeline
agent:
  machine:
    type: e1-standard-2
    os_image: ubuntu2004
blocks:
  - name: AWS Login Test
    dependencies: []
    task:
      secrets:
        - name: awskey
      jobs:
        - name: List buckets
          commands:
            - echo "Accessing $AWS_DEFAULT_REGION"
            - aws s3 ls
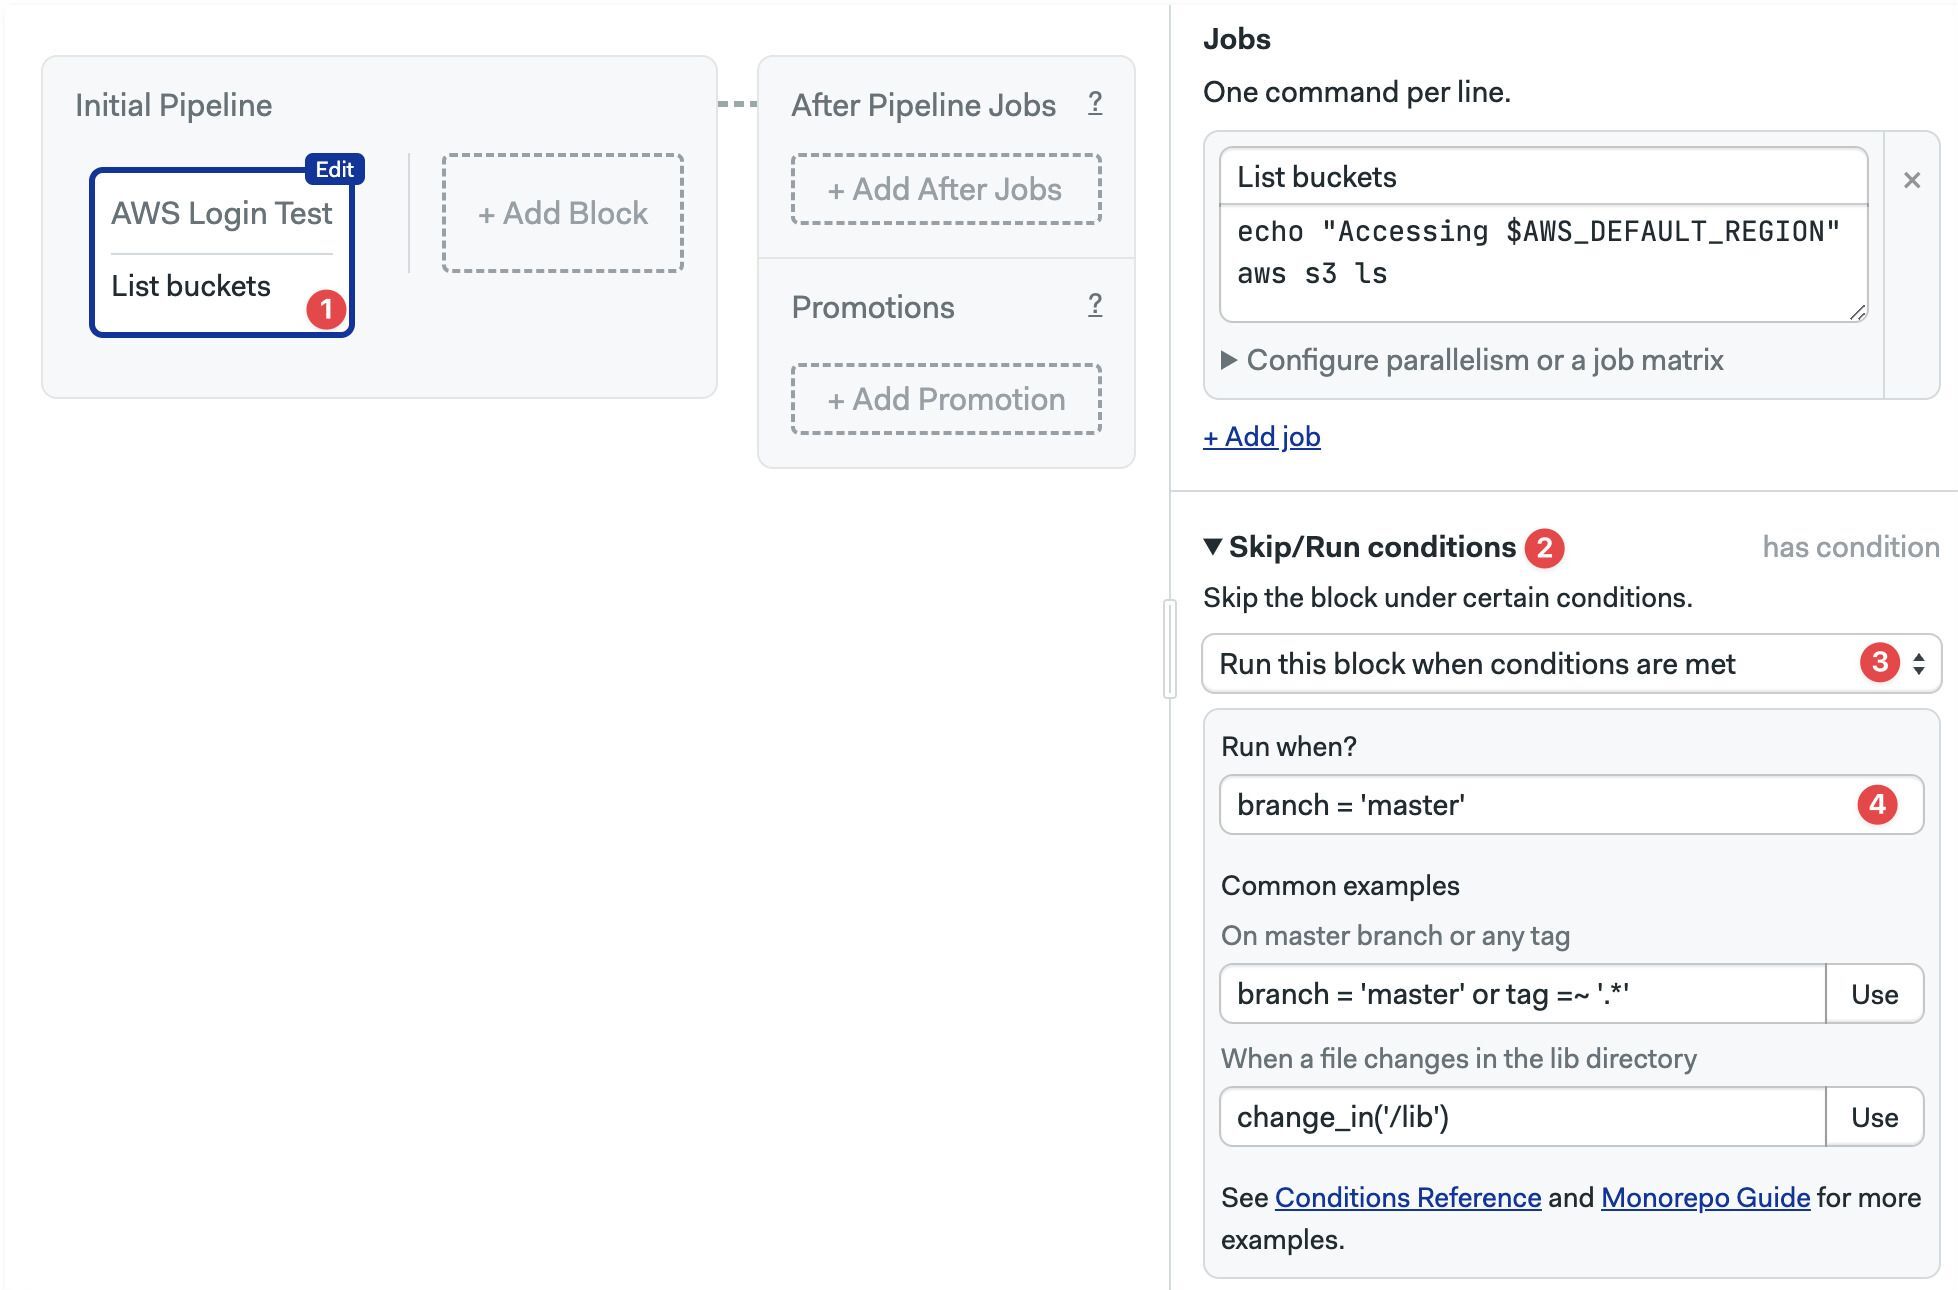
Skip/run conditions
You can choose to skip or run the block only under certain conditions. Skipping a block means that none of its job are executed.
Use cases for this feature include skipping a block on certain branches, or working with monorepo projects.
- Editor
- YAML (Run/When)
- YAML (Skip/When)
- Select the block
- Open the Skip/Run conditions section (you may need to scroll down)
- Select Run this block when... or Skip this block when...
- Type the conditions to run or skip the block
- Select the block where to edit the conditions
- Under the block
nameaddrunandwhen - Type the condition that causes the block to run
version: v1.0
name: Initial Pipeline
agent:
  machine:
    type: e1-standard-2
    os_image: ubuntu2004
blocks:
  - name: Build
    dependencies: []
    run:
      when: branch = 'master'
    task:
      jobs:
        - name: Build
          commands:
            - checkout
            - npm run build
- Select the block where to edit the conditions
- Under the block
name, addskipandwhenkeys - Type the condition that causes the block to be skipped
version: v1.0
name: Initial Pipeline
agent:
  machine:
    type: e1-standard-2
    os_image: ubuntu2004
blocks:
  - name: Build
    dependencies: []
    skip:
      when: branch = 'master'
    task:
      jobs:
        - name: Build
          commands:
            - checkout
            - npm run build
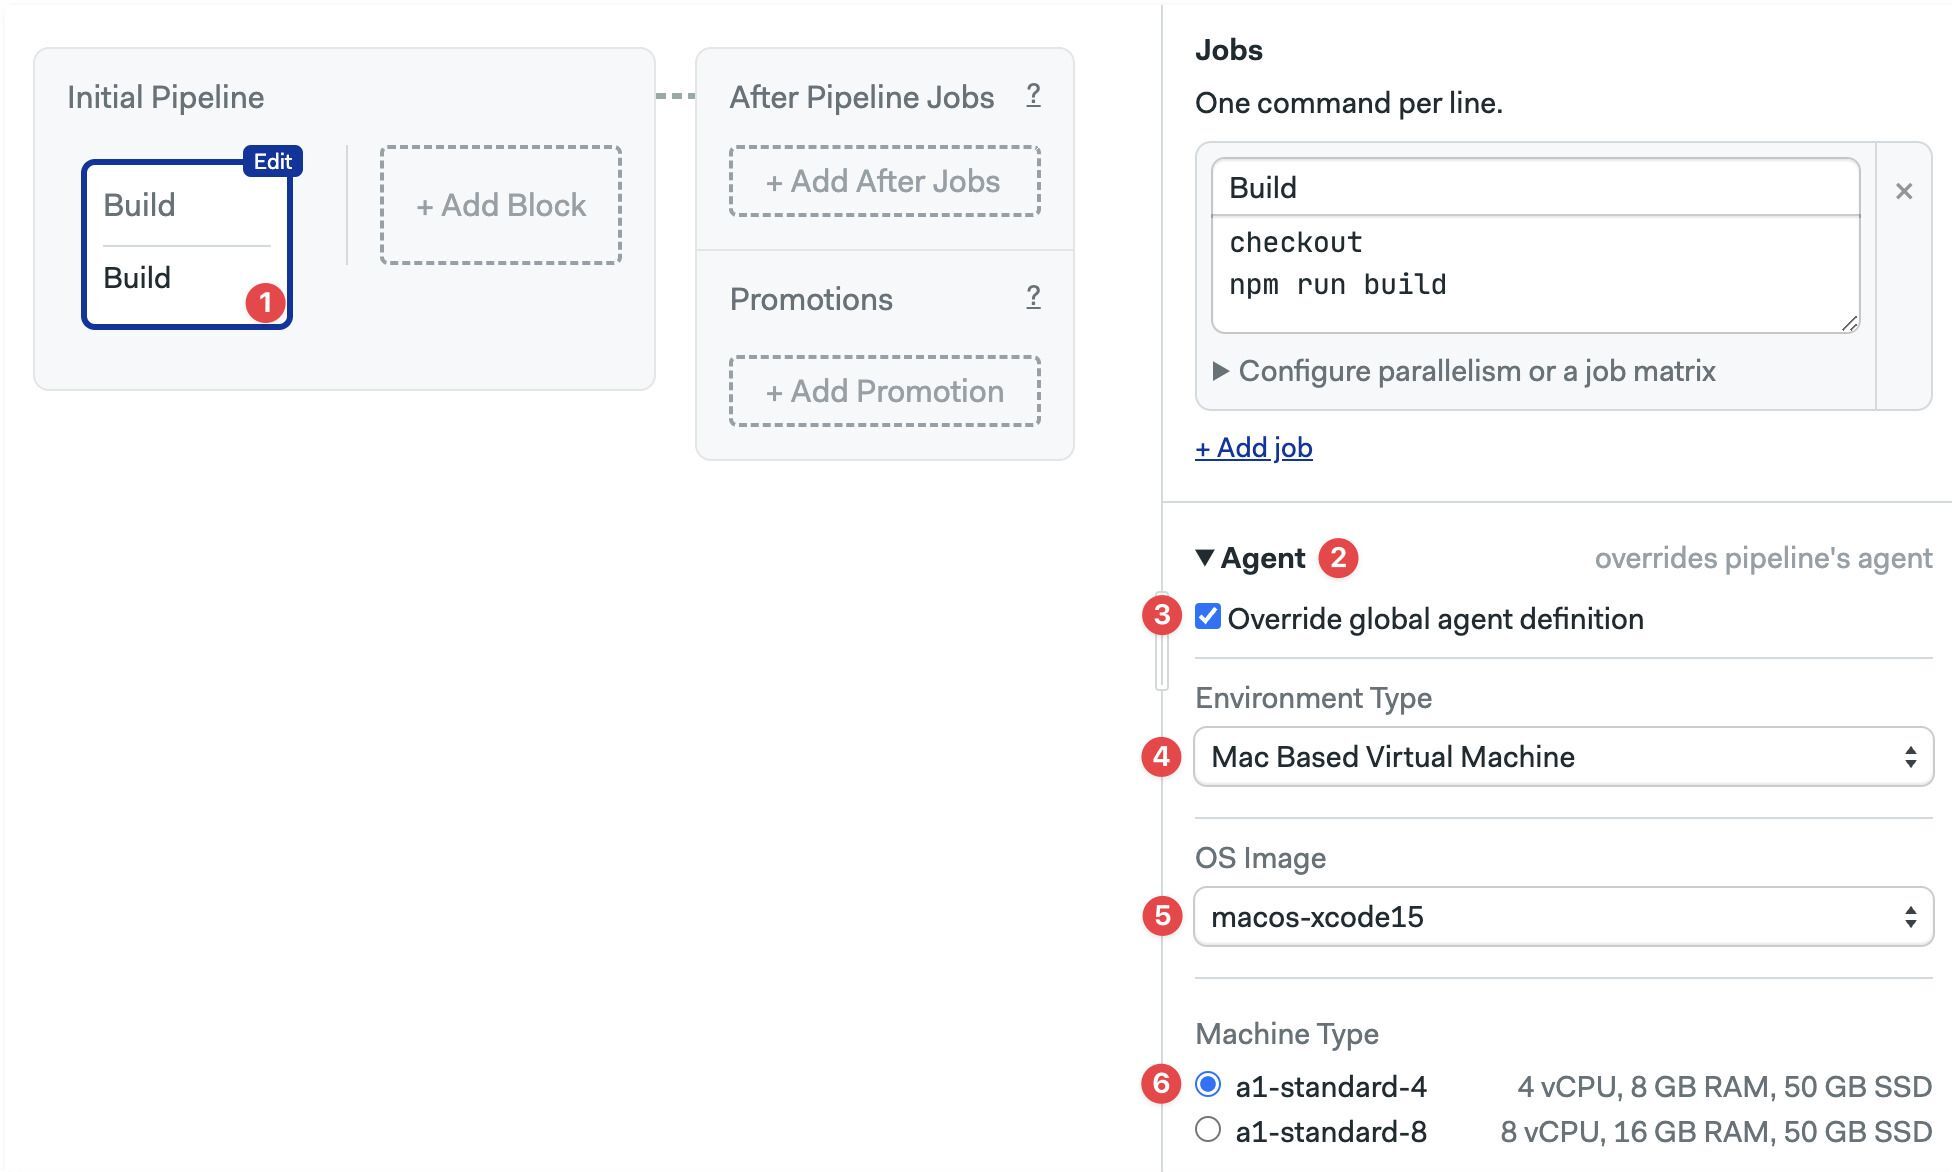
Agent
Here you can override the pipeline-level agent for a specific job. You can select VMs running Linux, macOS, or Windows (self-hosted only) in both X86 and ARM architectures. This setting also allows you to run the job in self-hosted agents or in Docker environments.
- Editor
- YAML
- Select the block
- Open the Agent section (you may need to scroll down)
- Select the Environment Type
- Select the OS Image
- Select the Machine Type
- Select the block where you want to override the agent.
- Add an
agentkey under thetask - Set the
machineandos_image
version: v1.0
name: Initial Pipeline
agent:
  machine:
    type: e1-standard-2
    os_image: ubuntu2004
blocks:
  - name: Build
    dependencies: []
    task:
      agent:
        machine:
          type: a1-standard-4
          os_image: macos-xcode15
      jobs:
        - name: Build
          commands:
            - checkout
            - npm run build
Job parallelism
Job parallelism expands a job into multiple parallel jobs. You can use this feature to run a test suite faster by spreading the load among multiple agents.
To take full advantage of job parallelism you need to partition your test suite. Semaphore does not partition tests automatically, but it enables 3rd party test runners like Knapsack or Semaphore Test Booster (Ruby) to even the load with a partition strategy that you can configure.
When coupled your own partitioning strategy, test parallelism allows you to speed up large tests suite by horizontally scaling the tests.
When job parallelism is enabled two new environment variables are available in the job environment:
SEMAPHORE_JOB_COUNT: the total number of jobs running on the parallelism setSEMAPHORE_JOB_INDEX: a value between 1 and$SEMAPHORE_JOB_COUNTrepresenting the current job instance of the parallelism set
- Editor
- YAML
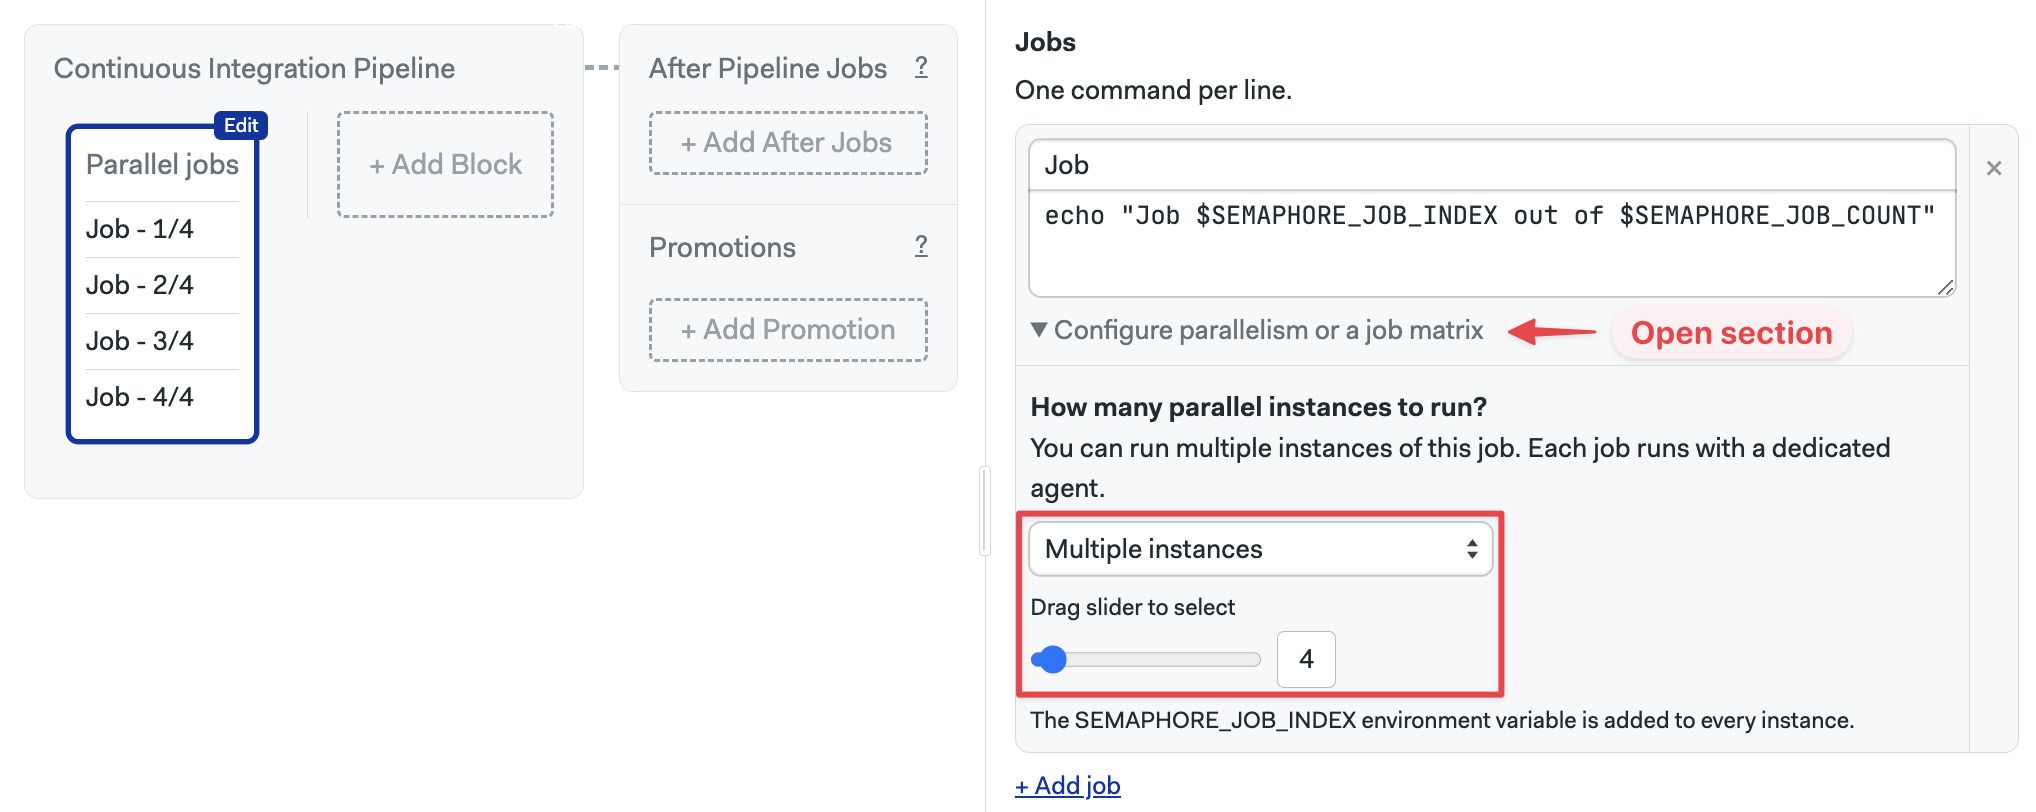
To use job parallelism, follow these steps:
- Open the workflow editor
- Select or create a job
- Open the section under the job Configure parallelism or a job matrix
- Select Multiple instances
- Drag the slider to select the number of jobs to run in the parallelism set
- Type the commands, you can use the variable counter as environment variables
- Press Run the workflow, then Start
To enable job parallelism, follow these steps:
- Open the pipeline YAML
- Locate or create the job
- Type the commands
- Add a
parallelismkey with the desired job parallelism value - Save the file and push it to the repository
The following example creates four jobs, each printing a different line in the log:
- "Job 1 out of 4"
- "Job 2 out of 4"
- "Job 3 out of 4"
- "Job 4 out of 4"
version: v1.0
name: Continuous Integration Pipeline
agent:
  machine:
    type: e1-standard-2
    os_image: ubuntu2004
blocks:
  - name: Parallel jobs
    dependencies: []
    task:
      jobs:
        - name: Job
          commands:
            - echo "Job $SEMAPHORE_JOB_INDEX out of $SEMAPHORE_JOB_COUNT"
          parallelism: 4
It's not possible to use job parallelism at the same time as job matrices.
Job matrix
A job matrix is a more advanced form of job parallelism where you can define multiple variables with different values and run all the possible permutations.
For example, let's say we want to test our application using three Node.js versions using npm and yarn
- Node.js versions: v22.5.1, v21.7.3, and v20.15.1
- Package managers: npm, and yarn
We have a total of 6 possible test jobs when we take into account all permutations. Usually, we would need to manually create these jobs, but with job matrix we can specify the variables and values and let Semaphore expand one job into all the possible permutations.
- Editor
- YAML
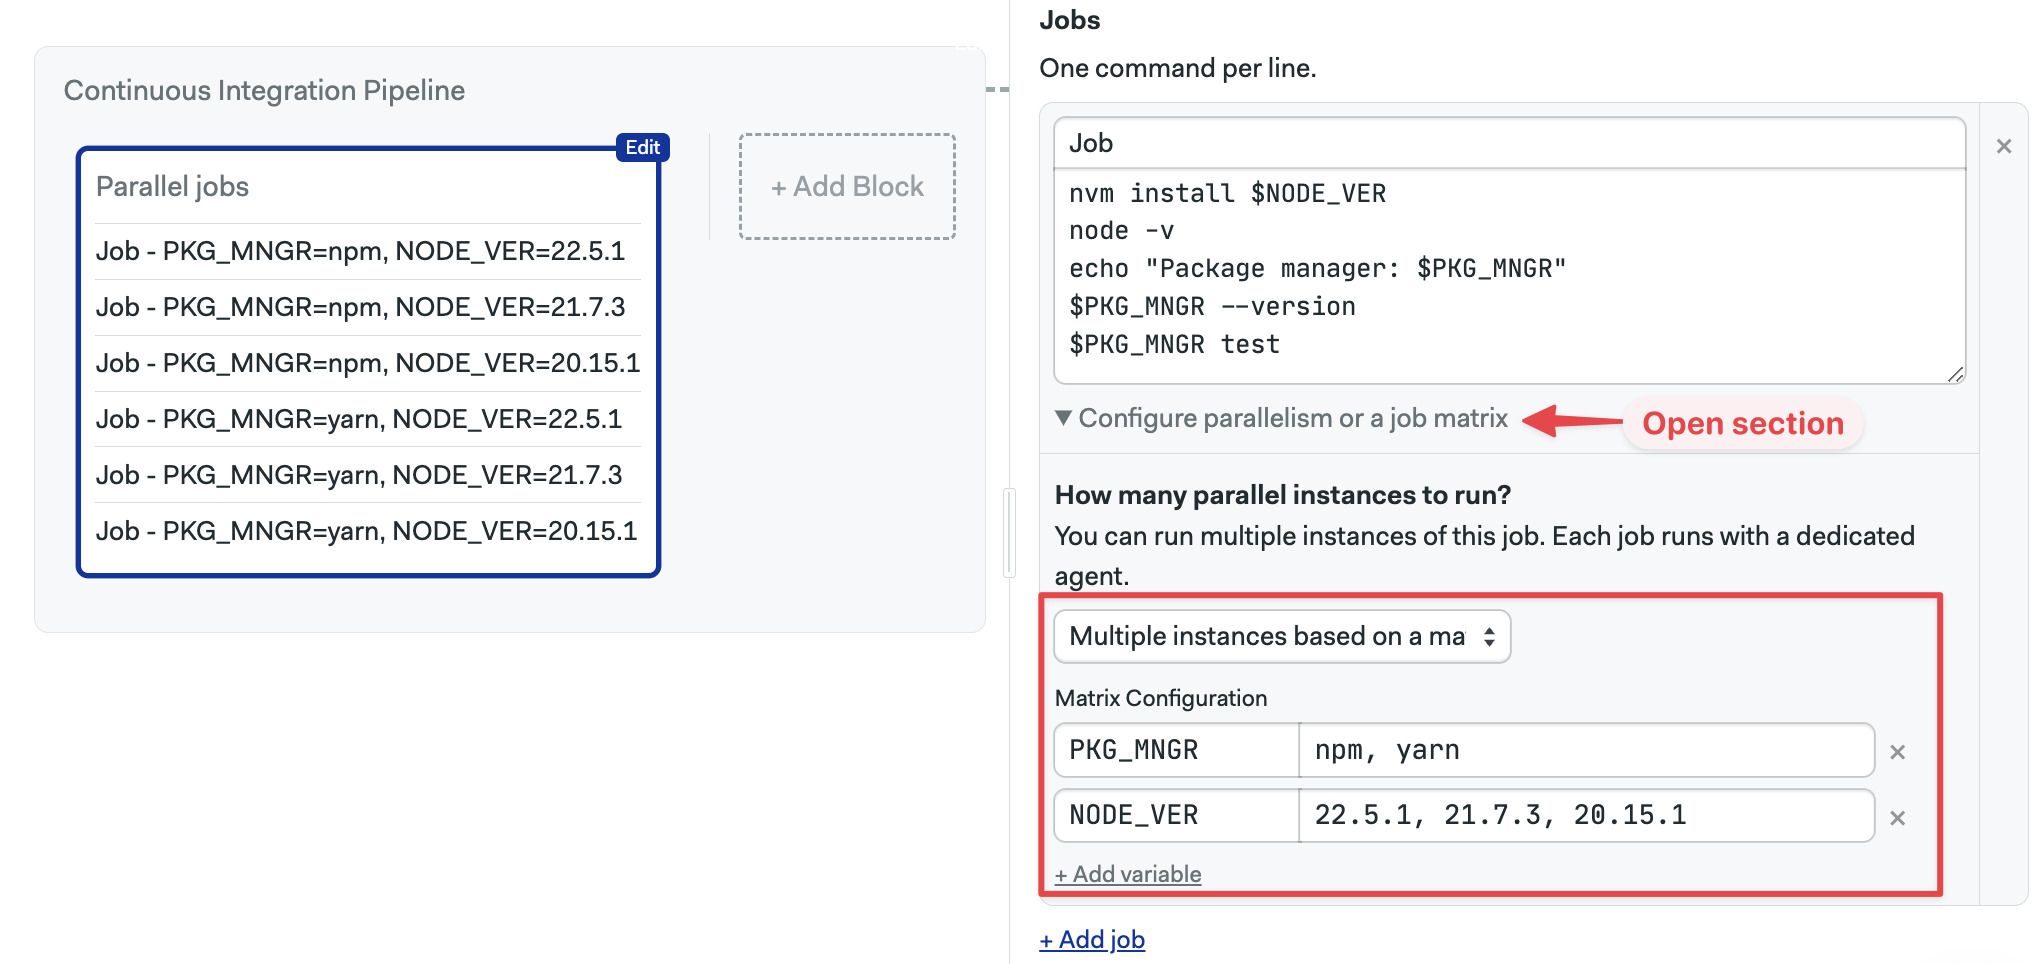
To create a job matrix, follow these steps:
- Open the workflow editor
- Select or create the job
- Open the section under the job Configure parallelism or a job matrix
- Select Multiple instances based on a matrix
- Type the variable names
- Type the possible values of the variable separated by commands
- Add more variables as needed
- Type the commands. The variables are available as environment variables
- Press Run the workflow, then Start
Semaphore automatically expands all possible permutations and adds the variables part of the job name
To use a job matrix, follow these steps:
- Open the pipeline YAML
- Locate or create the job
- Add a
matrixkey - Inside the matrix element add
env_varand the name of the variable - Add
valuesand a list of values for the variable - Type the job commands, you can use the variable names as environment variables
- Save the file and push it to the repository
The following example runs a 2 x 3 matrix with variables NODE_VER and PKG_MNGR. Semaphore expands the job into 6 parametererized jobs:
version: v1.0
name: Continuous Integration Pipeline
agent:
  machine:
    type: e1-standard-2
    os_image: ubuntu2004
blocks:
  - name: Job matrix
    dependencies: []
    task:
      jobs:
        - name: Job
          commands:
            - nvm install $NODE_VER
            - node -v
            - 'echo "Package manager: $PKG_MNGR"'
            - $PKG_MNGR --version
            - $PKG_MNGR test
          matrix:
            - env_var: PKG_MNGR
              values:
                - npm
                - yarn
            - env_var: NODE_VER
              values:
                - 22.5.1
                - 21.7.3
                - 20.15.1
Using job matrices causes Semaphore to run an initialization job before your jobs are executed.
Job priority
Every job in Semaphore has an internal priority value from 0 to 100. Job prioritization determines which jobs will get a machine assigned first when all agents are in use.
The priority of a job matters when there are more jobs than available agents. Because paid plans do not enforce limits on the number of available agents, the job priority value is only useful in two situations:
- For projects on organizations on free and open source plans. These plans enforce concurrency limits
- For projects running on a limited number of self-hosted agents
Default priorities
The priorities are assigned automatically according to the table below, but they can be configured on a per-job or per-pipeline basis.
| Job type | Branch | Default priority |
|---|---|---|
| Promotion pipeline | master | 65 |
| Promotion pipeline | non-master | 55 |
| Promotion pipeline | tags | 55 |
| Promotion pipeline | pull requests | 55 |
| Initial pipeline | master | 60 |
| Initial pipeline | non-master | 50 |
| Initial pipeline | tags | 50 |
| Initial pipeline | pull requests | 50 |
| After pipeline | any | 45 |
| Tasks | any | 40 |
Assigning priorities
To assign a different priority to a specific job, follow these steps:
- Open the pipeline YAML
- Locate the jobs
- Create a
prioritykey - Define a
valueand a condition - Save the file and push it to the repository
The following example shows how to assign a higher priority to specific jobs when the branch is master:
version: v1.0
name: Job priorities
agent:
  machine:
    type: e1-standard-2
    os_image: ubuntu2004

blocks:
  - name: Tests
    task:
      jobs:
      - name: Unit tests
        priority:
        - value: 70
          when: "branch = 'master'"
        - value: 45
          when: true
        commands:
          - make unit-test
      - name: Integration tests
        priority:
        - value: 58
          when: "branch = 'master'"
        - value: 42
          when: true
        commands:
          - make integration-test
To change the priority to all jobs in a pipeline, follow these steps:
- Open the pipeline YAML
- Locate the jobs
- Add a
global_job_configkey at the root of the YAM - Create a
prioritykey - Define a
valueand a condition - Save the file and push it to the repository
The following example does the same as the one above, but using a global config:
version: "v1.0"
name: An example of using global_job_config
agent:
  machine:
    type: e1-standard-2
    os_image: ubuntu2004

global_job_config:
  priority:
  - value: 70
    when: "branch = 'master'"
  - value: 45
    when: true

blocks:
  - name: Tests
    task:
      jobs:
      - name: Unit tests
        commands:
          - make unit-test
      - name: Integration tests
        commands:
          - make integration-test
See the pipeline YAML reference for more details.
Job and block limits
Semaphore enforces a few limits to prevent misconfigured jobs and runaway processes from consuming too many resources.
This section describes the limits that Semaphore applies to jobs and blocks. See pipelines limits to see limits that for pipelines.
Job duration
Jobs have a 1 hour limit. Jobs exceeding this limit are terminated.
You can change the limit up to a maximum value of 24 hours.
To change the maximum duration for a single job:
- Open the pipeline YAML
- Locate the job
- Add and
execution_time_limitelement - Add
hoursorminutes, set the new value - Save the file and push it to the repository
version: v1.0
name: Pipeline using execution_time_limit
agent:
  machine:
    type: e1-standard-2
    os_image: ubuntu2004
blocks:
  - name: Job limited to 3 hours
    execution_time_limit:
      hours: 3
    commands:
      - checkout
      - npm install
      - npm test
See pipeline global time limit to change the maximum duration for all jobs in a pipeline.
Max blocks per pipeline
A pipeline can have up to 100 blocks. This limit is not configurable.
If you have a use case in which this limit is too constraining, please contact us at support@semaphoreci.com and we will try to work out a solution.
Max jobs per block
A block can have up to 50 jobs. This limit is not configurable.
If you have a use case in which this limit is too constraining, please contact us at support@semaphoreci.com and we will try to work out a solution.
Max job log size
Job logs have a limit of 16 megabytes, which is roughly 100,000 lines. This limit is not configurable.
The following log message indicates that the job has exceeded the limit:
Content of the log is bigger than 16MB. Log is trimmed.
You can workaround this limitation by setting the following environment variable, which makes Semaphore upload the log file as an artifact when the limit is exceeded.
SEMAPHORE_AGENT_UPLOAD_JOB_LOGS=when-trimmed