Markdown Reports
Create rich custom reports and view them right next to your workflows and jobs.
Overview
The new Reports tab makes it easy to add clear, custom markdown reports right inside your job and workflow pages. You can include charts, summaries, and extra details without leaving Semaphore, so sharing build results and pipeline information is simpler.
Markdown Reports feature:
- Fully rendered Markdown: view Markdown files directly in the workflow or job pages, which are fully formatted for easy reading.
- Mermaid.js support: create live charts and diagrams to show your pipeline steps with Mermaid.js
- Quick report generation : use the test-results CLI to make basic job reports in seconds
- Fully customizable: include test results, deployment notes, or any other information you need to organize and explain your CI/CD process
For example, you can use them to show information about your build.
Visually show how long each command in your job takes
Obtain resource utilization metrics.
You can even use images in your reports. The following PNG image has been generated with dependency cruiser.
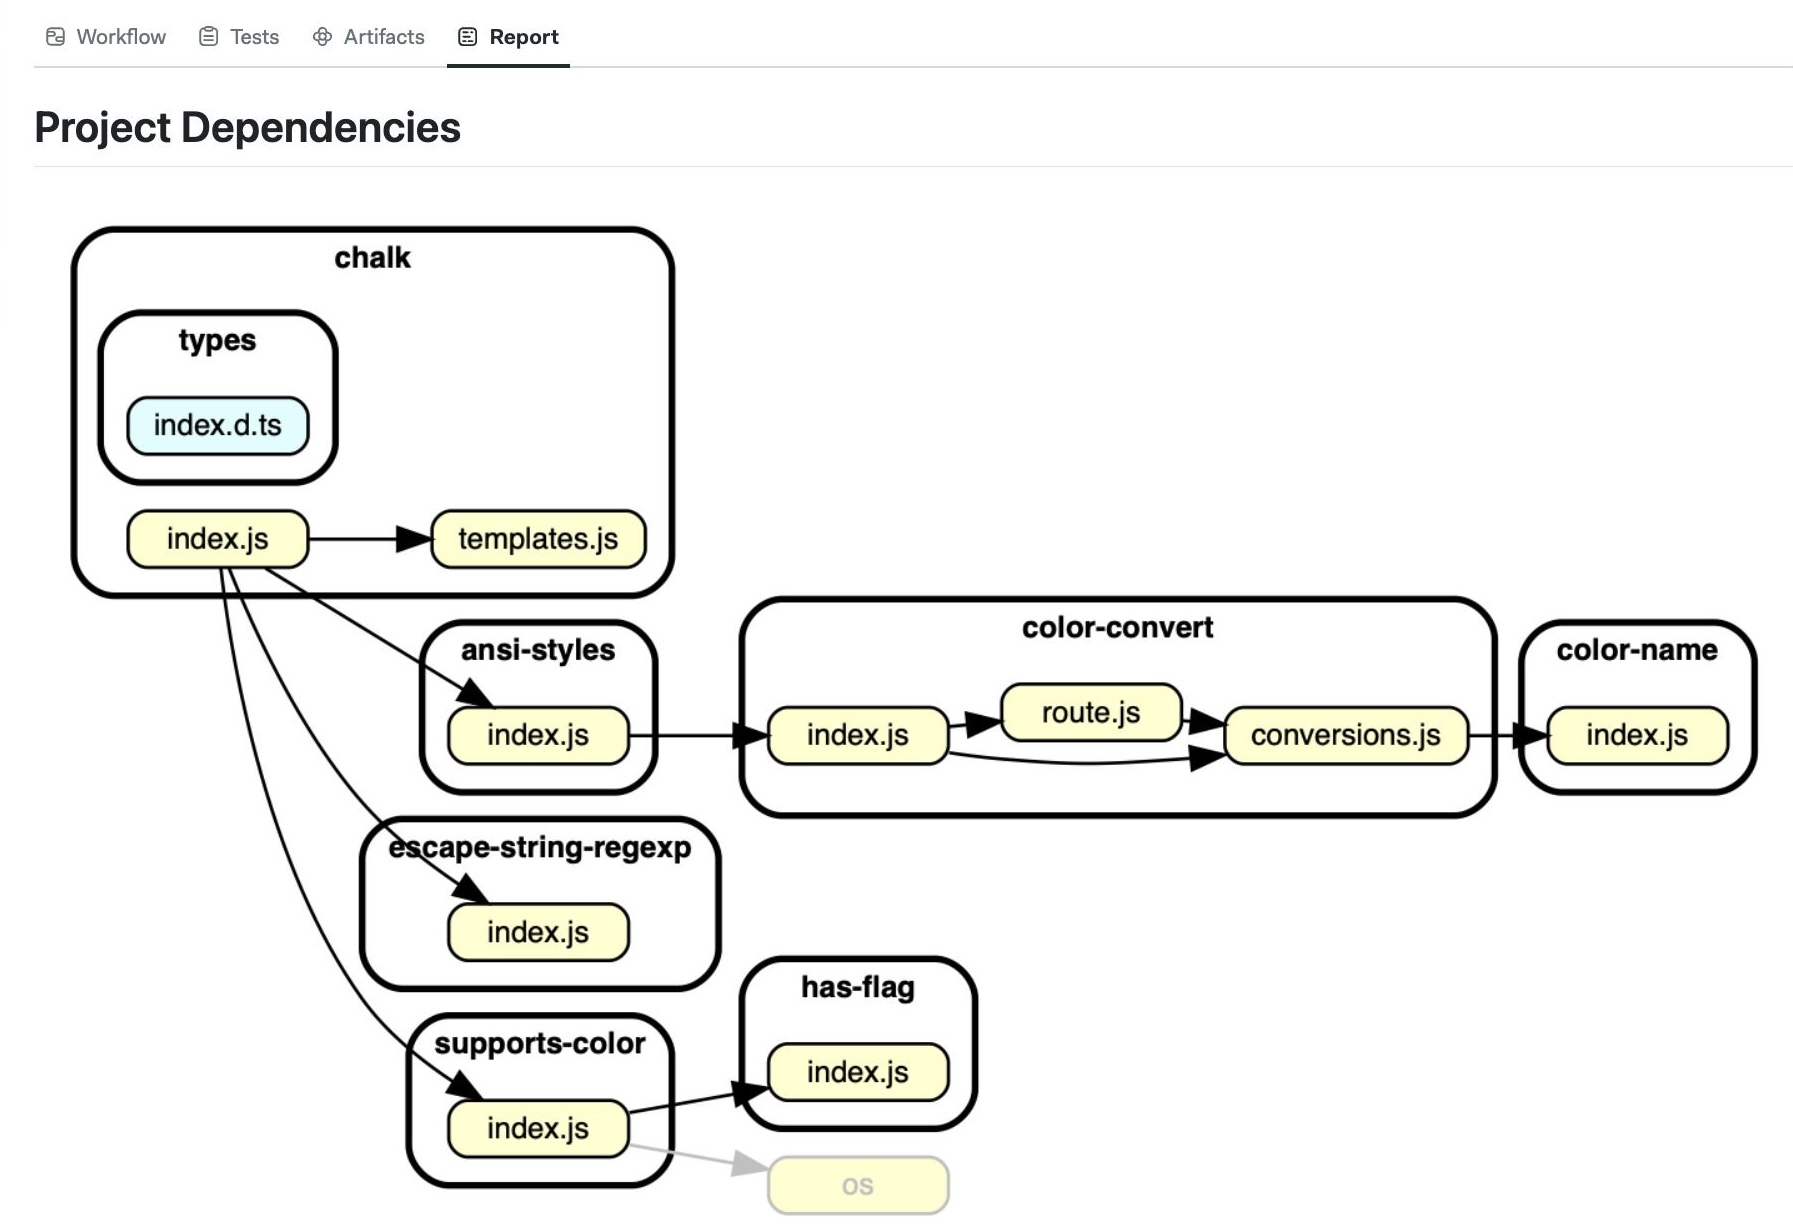
See the examples to learn how we generated these reports.
How to create reports
To use this feature, you must create an artifact on the following path: .semaphore/REPORT.md. The file must be formatted using Markdown.
You can create a Job report with:
artifact push job -d .semaphore/REPORT.md your-custom-report-file.md
To create a Workflow report, use:
artifact push workflow -d .semaphore/REPORT.md your-custom-report-file.md
Notice the use of the --destination (-d) argument to upload the report file into the expected path.
How to view reports
To view workflow reports, open the workflow and select the Report tab.
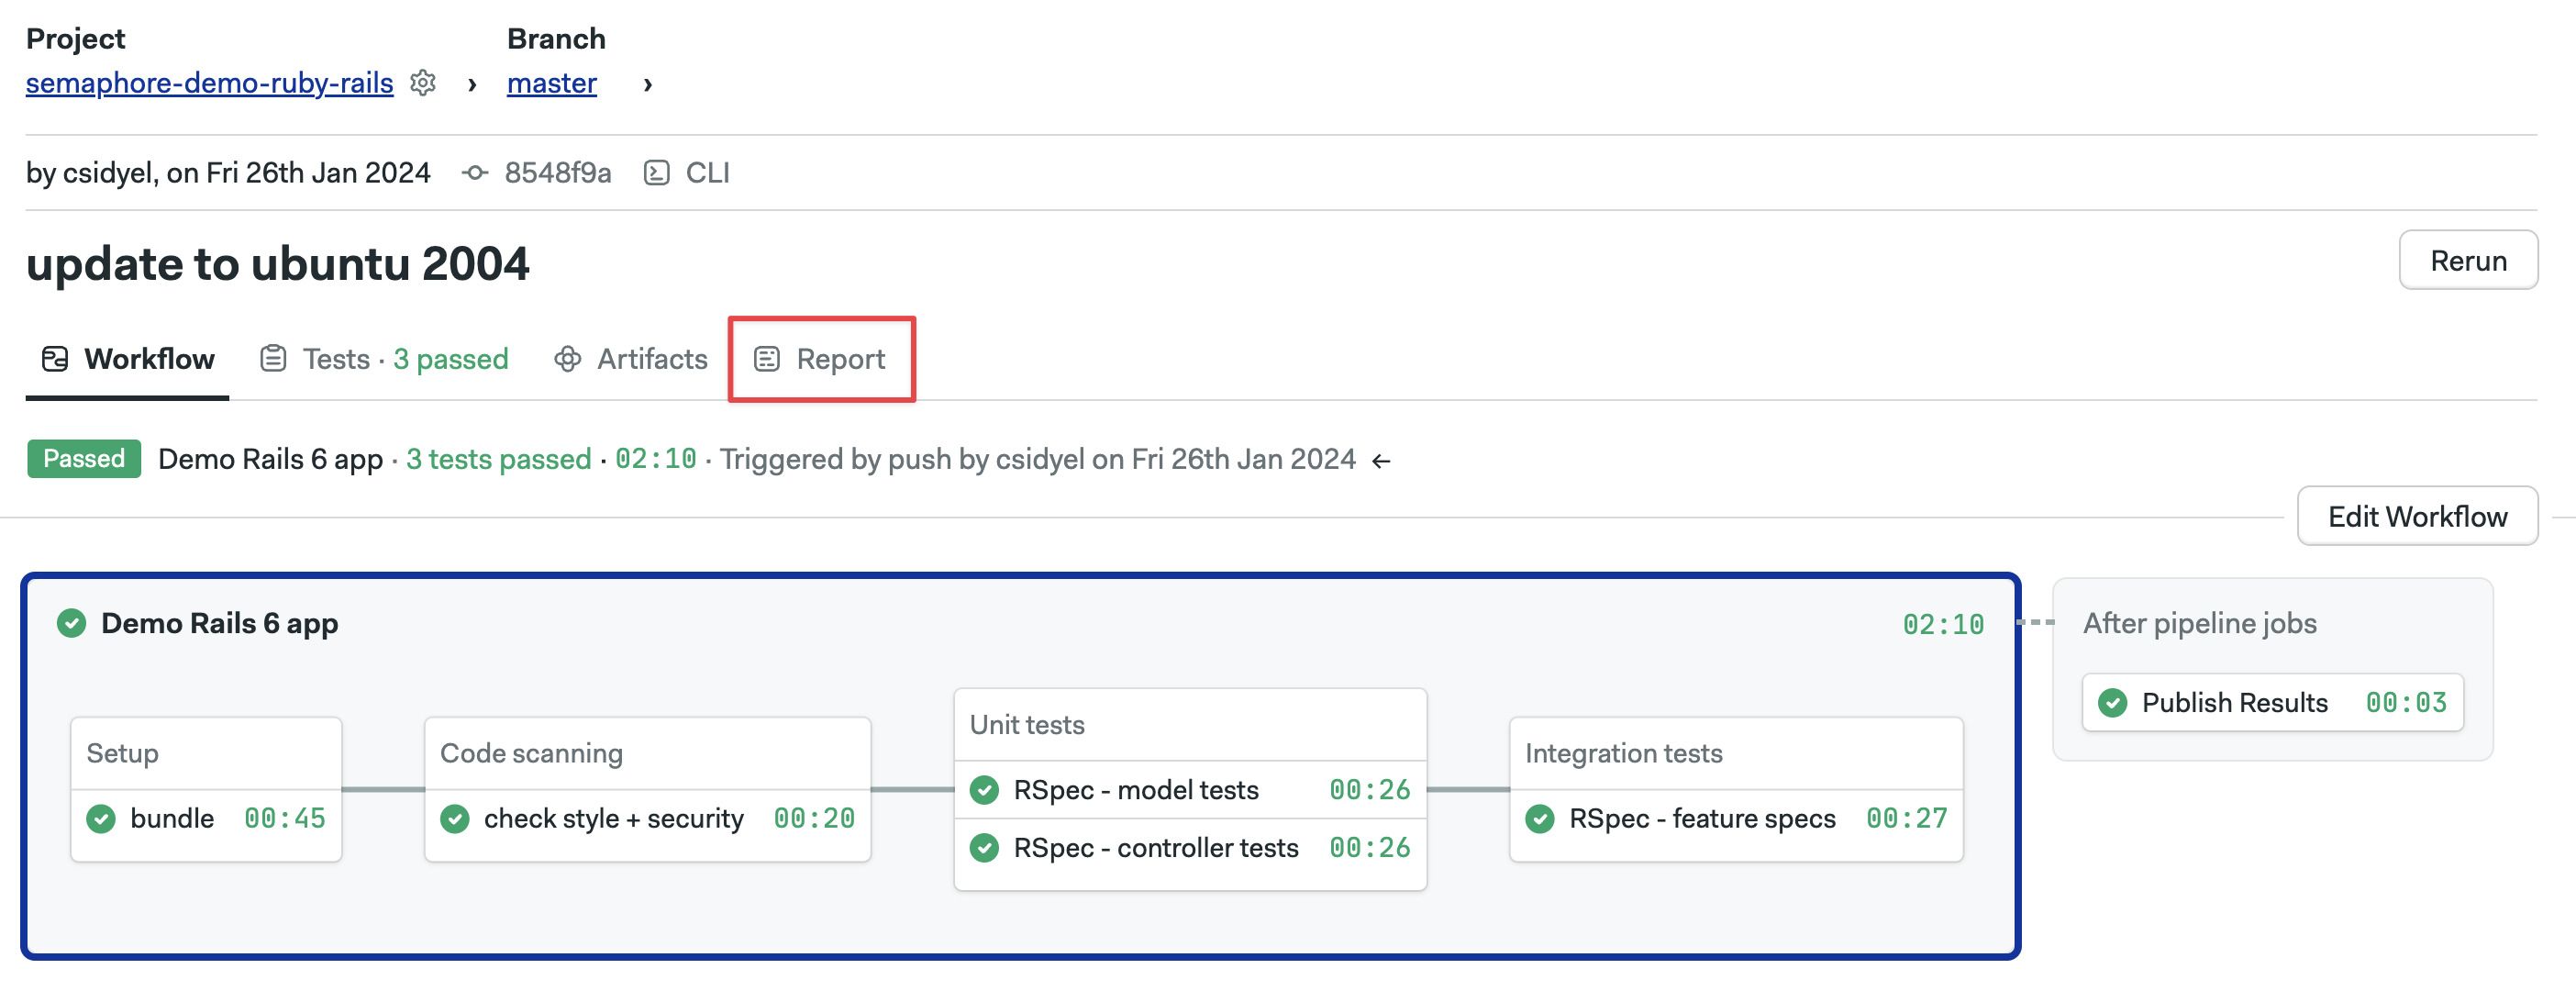
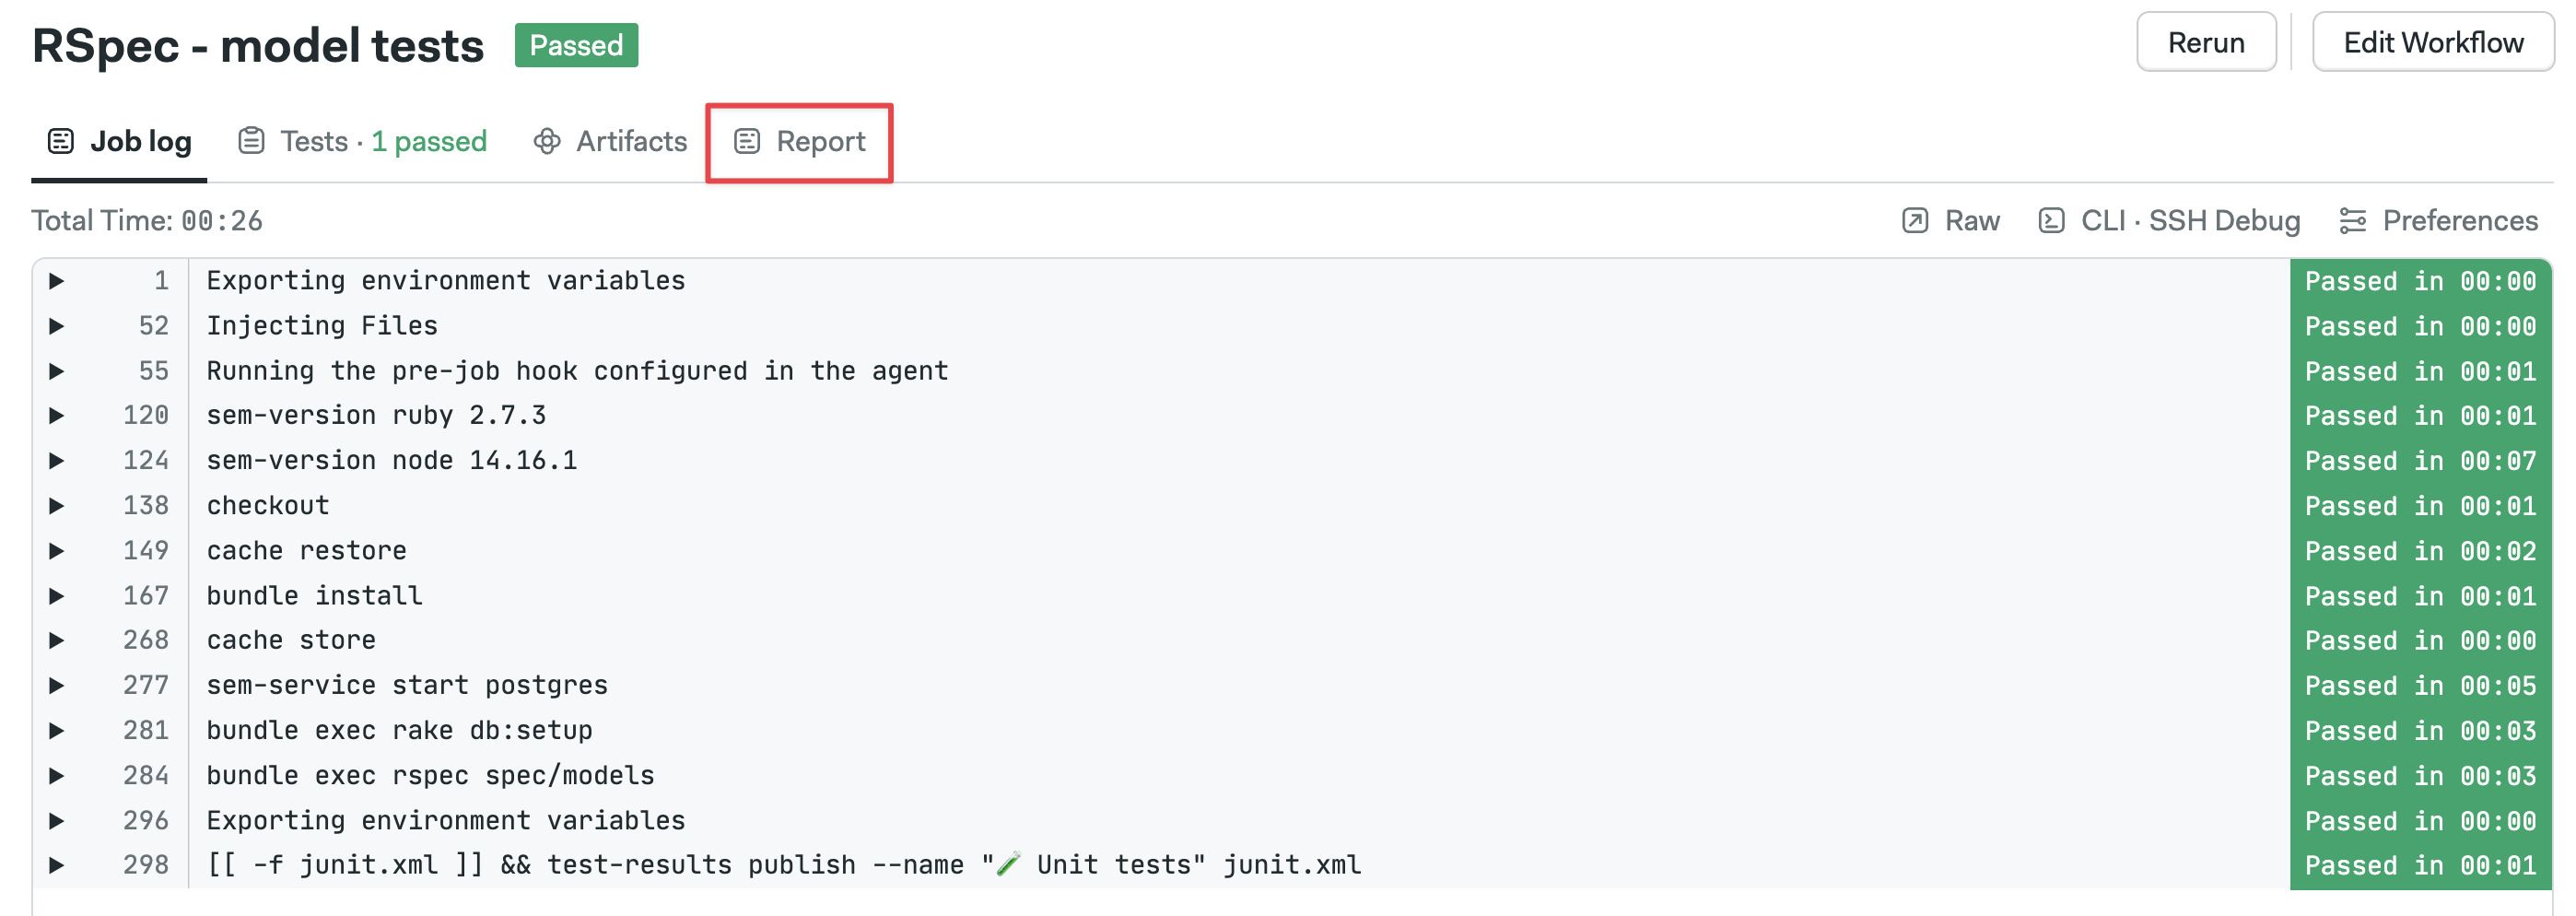
To view a job report, open the workflow, then go to the job you're interested in and select the Report tab.
If the reports tab is empty, check the following:
- That you are uploading the report to the correct artifact namespace, i.e.,
artifact push workflowvsartifact push job - That you are using the
--destinationor-dargument to upload the report with the name.semaphore/REPORT.md
There are no project-level reports. Only workflows and jobs show the report tab.
Examples
This section contains examples of how to dynamically generate reports in your pipelines. You may use these as a starting point for your reporting needs. You can produce complex reports by concatenating these examples into a single Markdown file.
Static reports
If you have a Markdown file you want to show as-is on the reports tabs, simply upload it as an artifact with:
checkout
artifact push workflow -d .semaphore/REPORT.md README.md
Environment variables
You can use environment variables in your source Markdown file, for example:
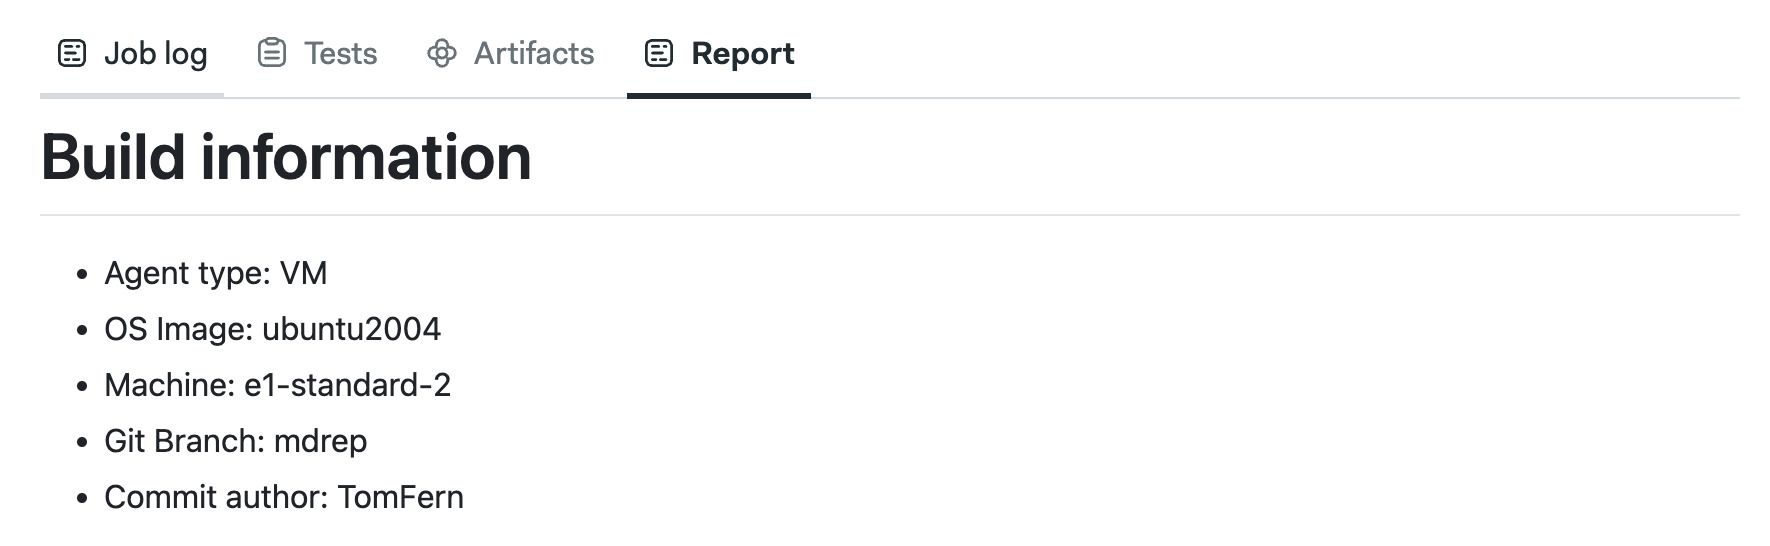
# Build information

- Agent type: ${SEMAPHORE_AGENT_MACHINE_ENVIRONMENT_TYPE}
- OS Image: ${SEMAPHORE_AGENT_MACHINE_OS_IMAGE}
- Machine: ${SEMAPHORE_AGENT_MACHINE_TYPE}
- Git Branch: ${SEMAPHORE_GIT_BRANCH}
- Commit author: ${SEMAPHORE_GIT_COMMIT_AUTHOR}
To expand the values of the variables during job execution, you may use envsubst in your job command. The following example exposes valuable information about the job found in Semaphore environment variables:
checkout
envsubst < build-info-template.md > build-info.md
artifact push job -d .semaphore/REPORT.md build-info.md
The report tab should show a report similar to this:
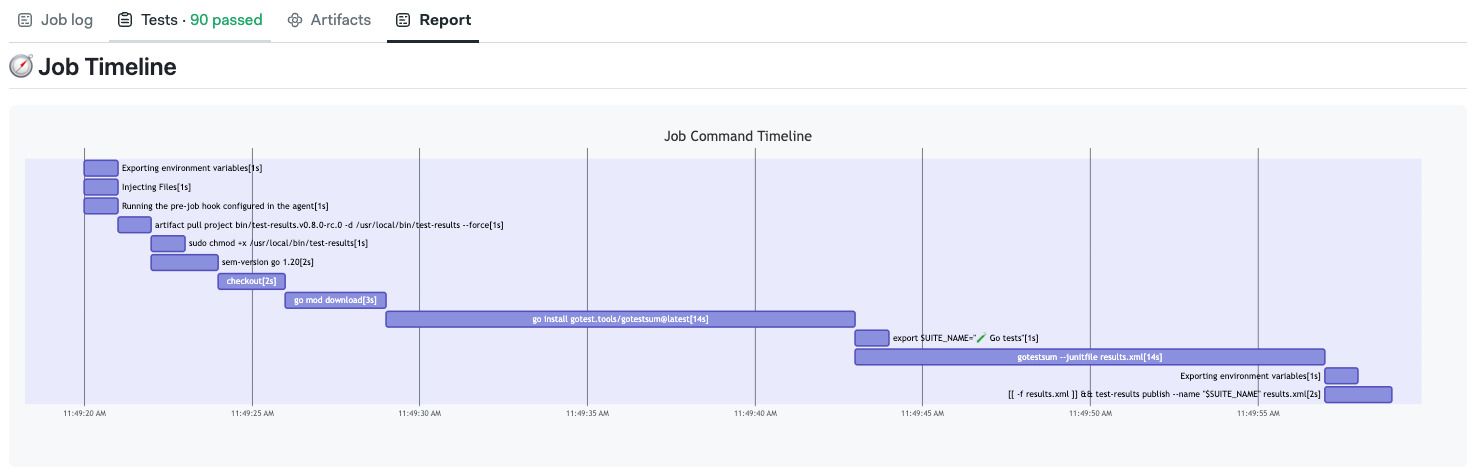
Command timeline
The test results CLI can generate a timeline chart showing the execution time for each command in the job.
The test-results command-metrics command generates a Mermaid diagram that shows the command timeline using a Gantt chart.
For example, appending the following lines to the end of your job commands:
test-results command-metrics timeline.md
artifact push job -d .semaphore/REPORT.md timeline.md
Produces the timeline report for that job. The command appends the report to the end of the file (if it exists). This report is useful for understanding how long each command takes to run.
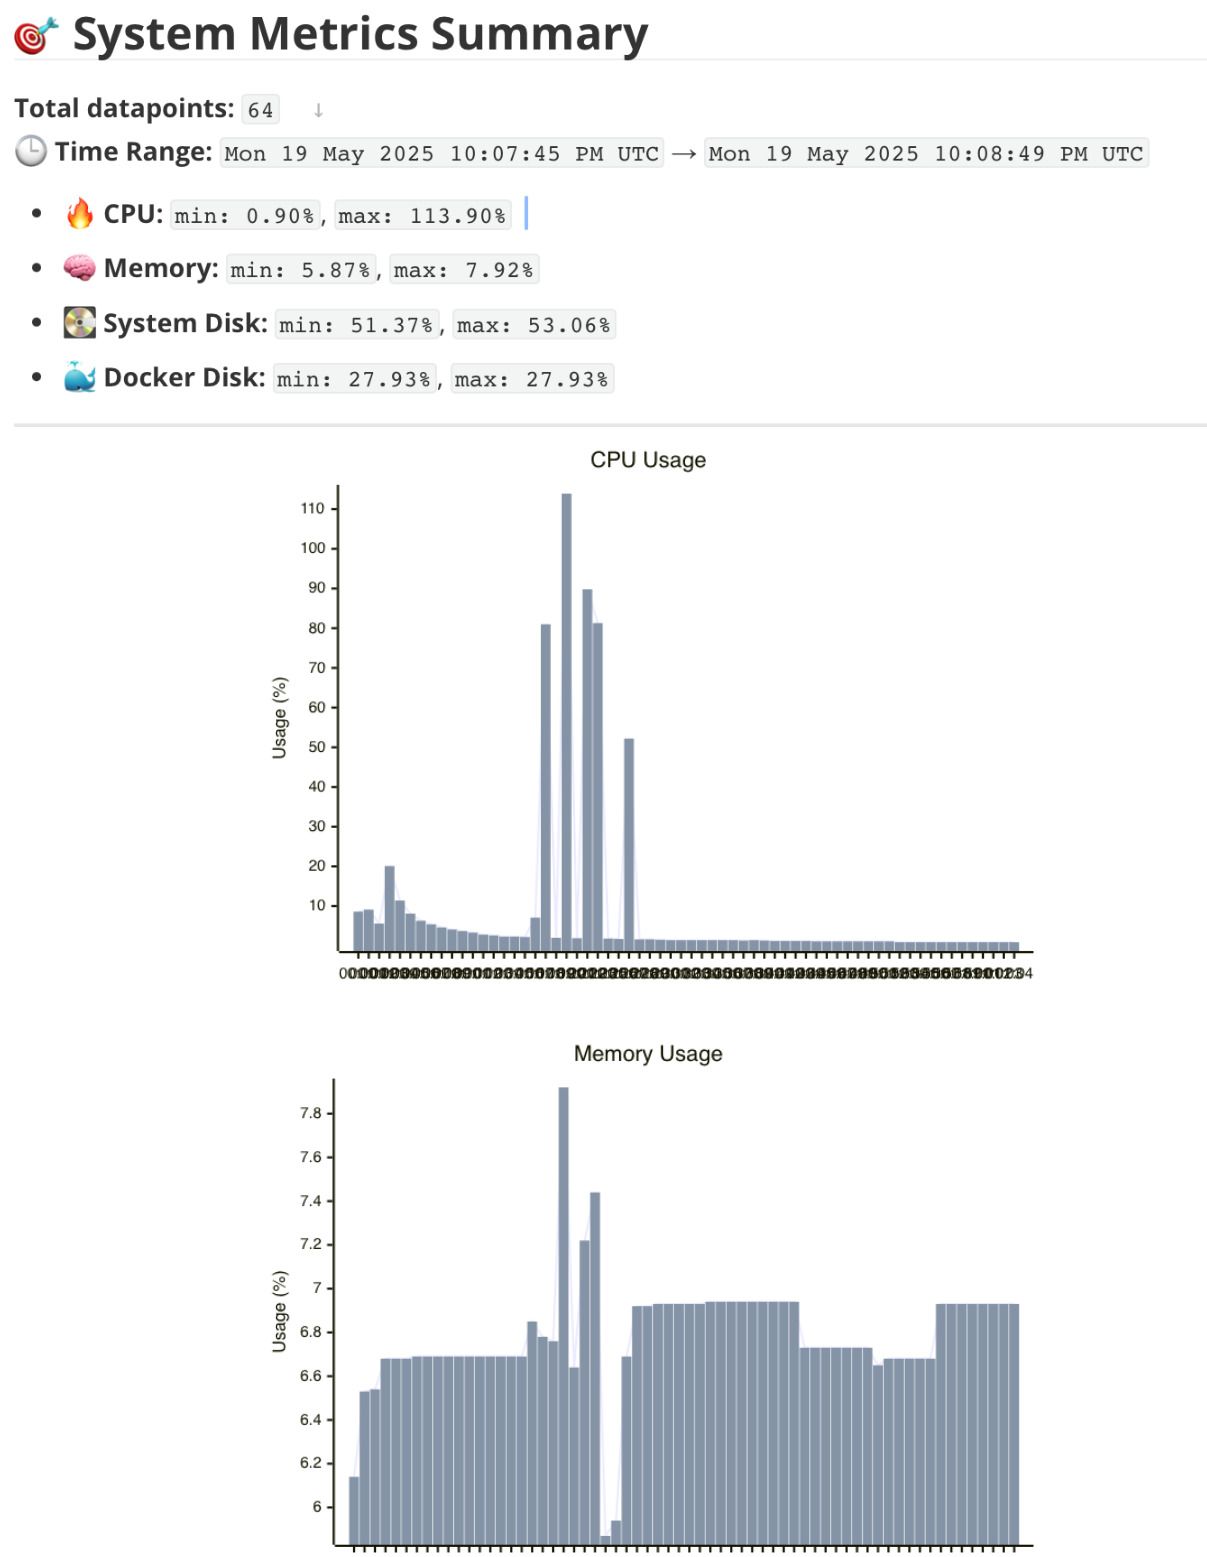
Resource metrics
The test results CLI generates a Mermaid diagram that shows the agent's a computer resources report.
For example, appending the following lines to the end of your job commands:
test-results resource-metrics resources.md
artifact push job -d .semaphore/REPORT.md resources.md
Produces the computer resource report with averages and utilization graphics. The command appends the report to the end of the file (if it exists). This report is useful for understanding how many resources the job is using while running.
Adding images
Local images in Markdown Reports do not work. For example, using  only shows a broken image.
To use images in your report, you have two options:
-
Remote storage: upload the image to a remote server, such as Google Bucket, and using the full URL
You can use the following commands to upload
image.pngto a Google Cloud and show it remotely on your report. You must ensure the bucket permissions allow public access for this to work.gsutil cp image.png gs://my-unique-bucket-name/
echo "# My image" > image.md
echo "
artifact push job -d .semaphore/REPORT.md image.md -
Base64 encoded images: Markdown supports embedding images as base64 encoded strings. This is less efficient, but it does not rely on external services to work
You can use the following commands to encode
image.pnginside the Markdown report:echo "# My image " > image.md
echo '')' >> image.md
artifact push job -d .semaphore/REPORT.md image.md
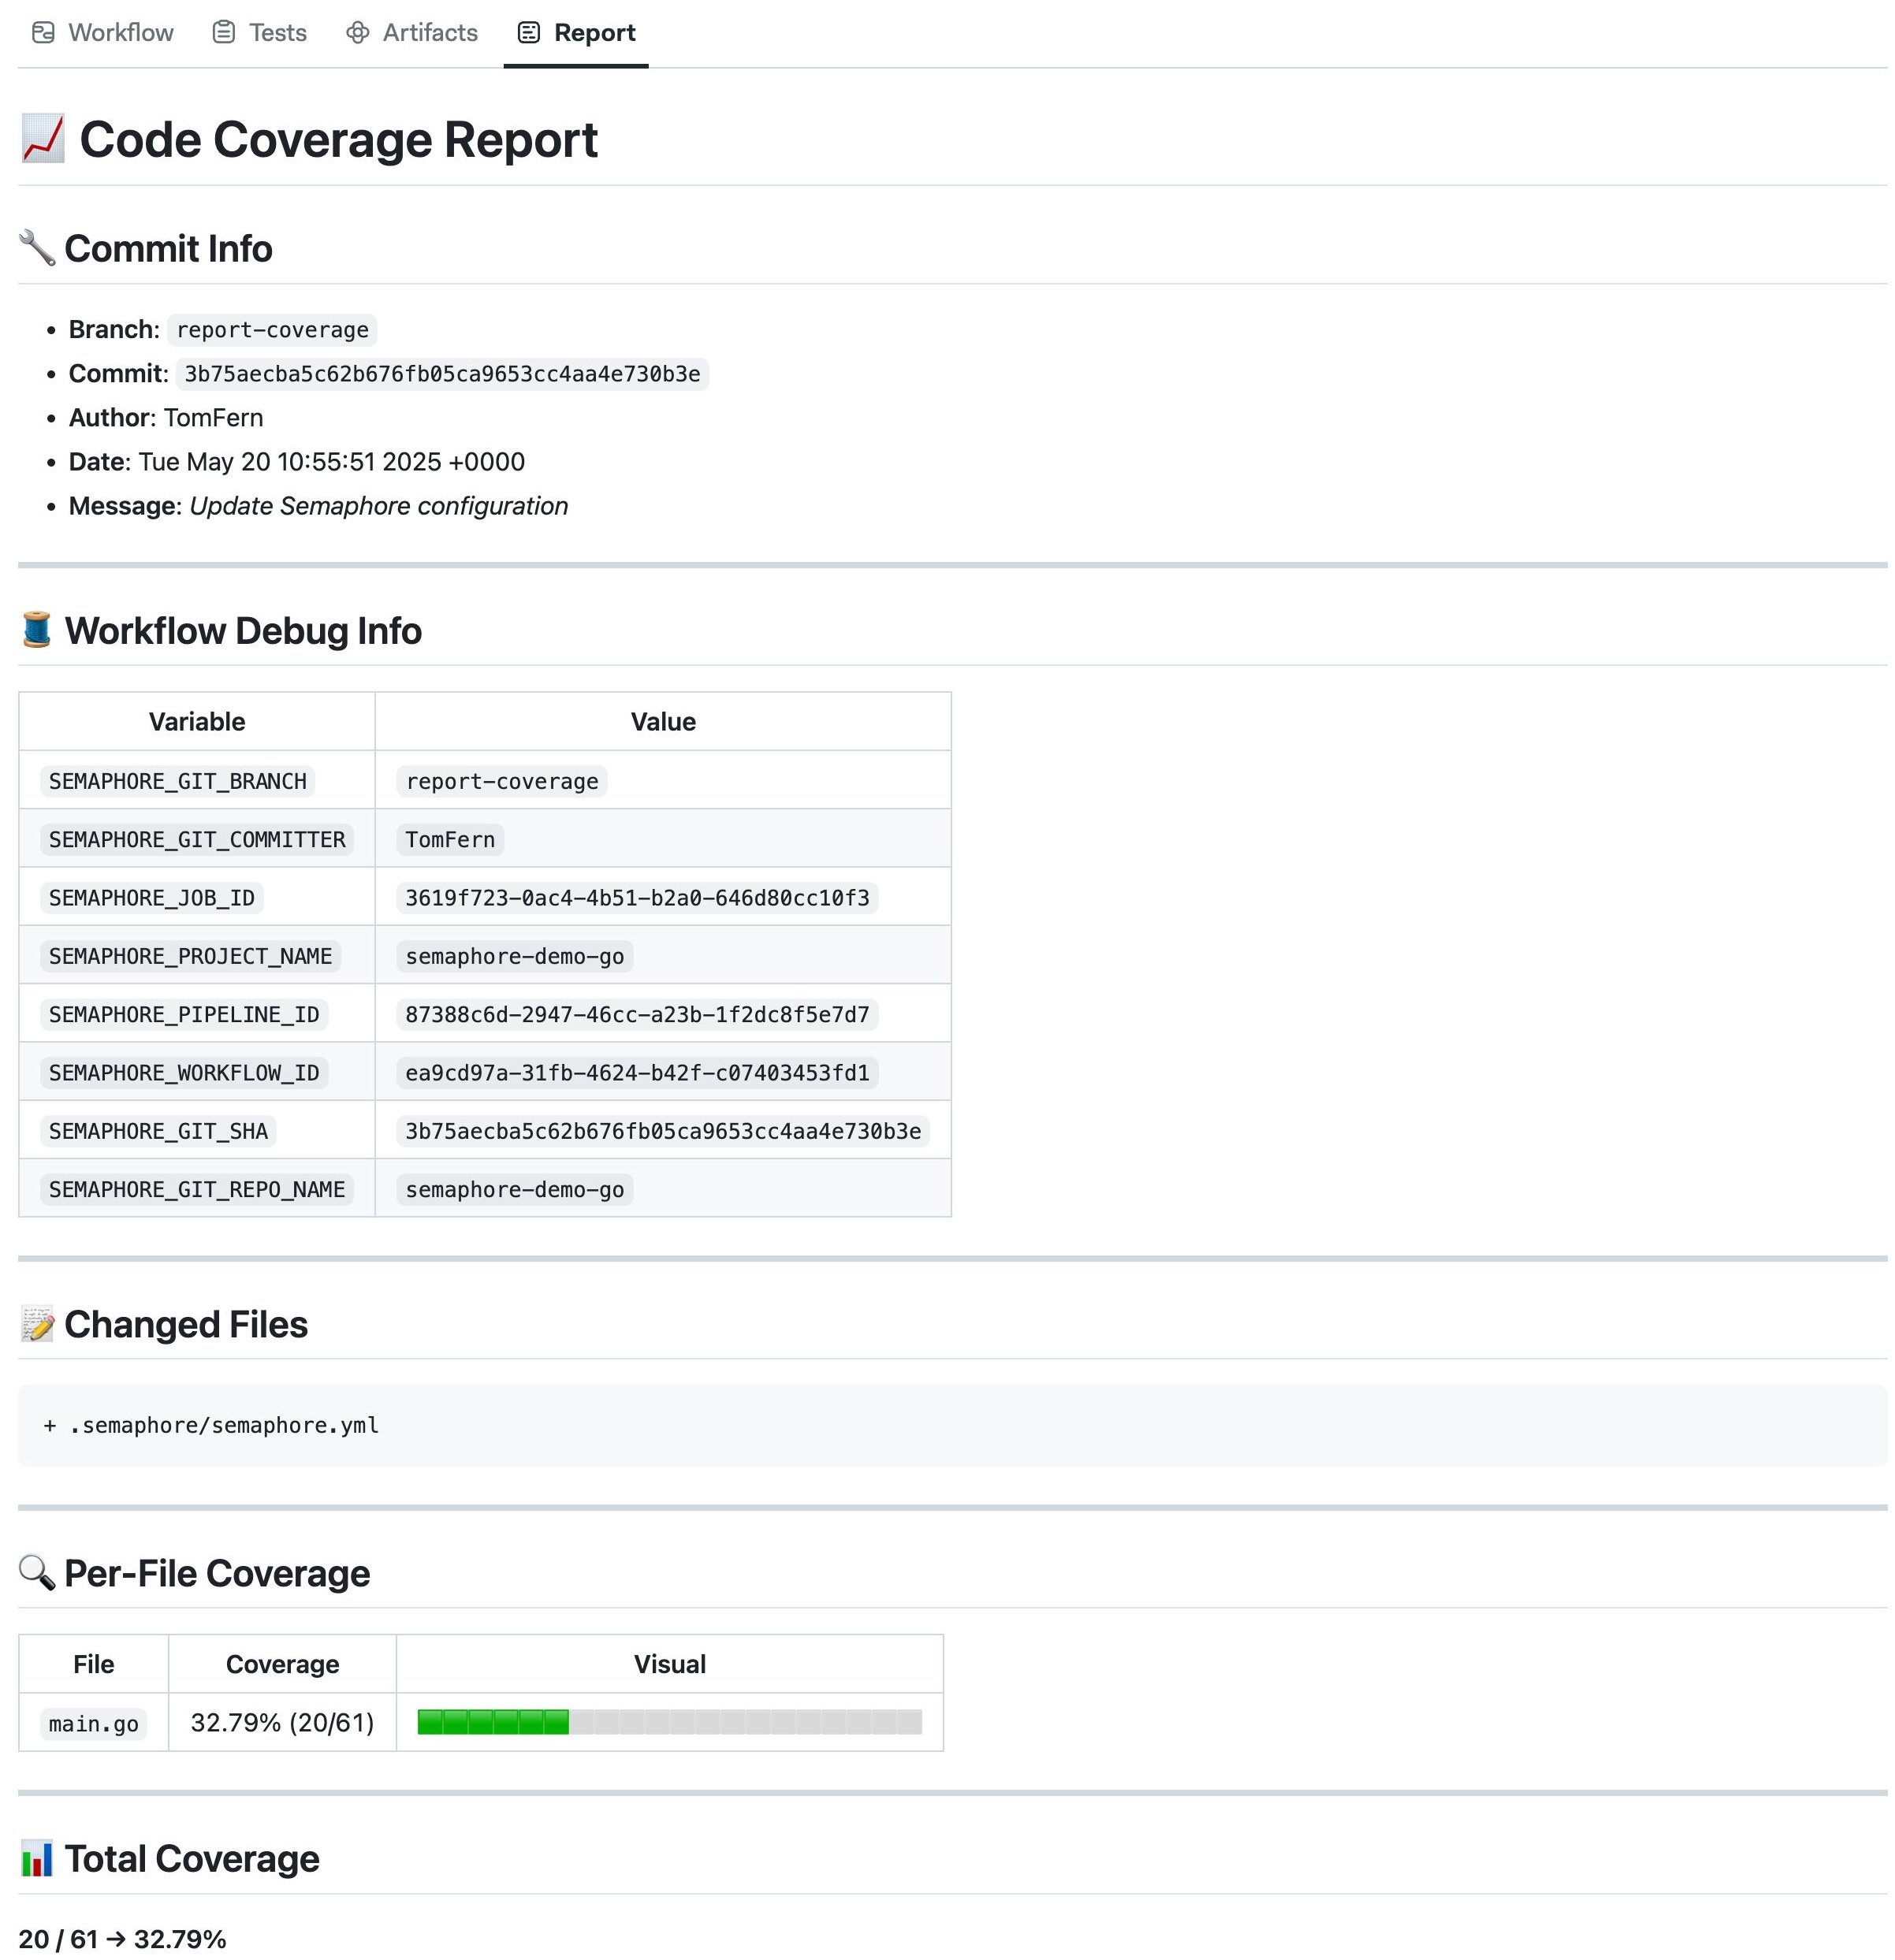
Coverage report for Go
The following example shows how to implement code coverage for Go projects:
go install github.com/jandelgado/gcov2lcov@latest
go install github.com/securego/gosec/v2/cmd/gosec@v2.19.0
go install golang.org/x/lint/golint@latest
go test -coverprofile=c.out ./...
gcov2lcov -infile=c.out -outfile=coverage.lcov
scripts/lcov-to-md
artifact push workflow -d .semaphore/REPORT.md COVERAGE.md
In the example, we use lcov-to-md to convert the Go coverage report to Markdown. These are the contents of the script:
#!/bin/bash

LCOV_FILE="coverage.lcov"
OUTPUT_FILE="COVERAGE.md"

# Git info
BRANCH=${SEMAPHORE_GIT_BRANCH:-$(git rev-parse --abbrev-ref HEAD)}
COMMIT=$(git rev-parse HEAD)
AUTHOR=$(git log -1 --pretty=format:'%an')
DATE=$(git log -1 --pretty=format:'%ad')
MESSAGE=$(git log -1 --pretty=format:'%s')
CHANGED_FILES=$(git diff-tree --no-commit-id --name-only -r HEAD)

# Temp file for sorting
TMP_FILE=$(mktemp)

OVERALL_TOTAL=0
OVERALL_COVERED=0
CURRENT_FILE=""
FILE_TOTAL=0
FILE_COVERED=0

while IFS= read -r line; do
  case "$line" in
    SF:*)
      CURRENT_FILE=$(basename "${line#SF:}")
      FILE_TOTAL=0
      FILE_COVERED=0
      ;;
    DA:*)
      count=$(echo "$line" | cut -d',' -f2)
      FILE_TOTAL=$((FILE_TOTAL + 1))
      OVERALL_TOTAL=$((OVERALL_TOTAL + 1))
      if [ "$count" -gt 0 ]; then
        FILE_COVERED=$((FILE_COVERED + 1))
        OVERALL_COVERED=$((OVERALL_COVERED + 1))
      fi
      ;;
    end_of_record)
      if [ -n "$CURRENT_FILE" ]; then
        if [ "$FILE_TOTAL" -gt 0 ]; then
          percent=$(awk "BEGIN { printf \"%.2f\", ($FILE_COVERED/$FILE_TOTAL)*100 }")
        else
          percent="0.00"
        fi
        printf "%07.2f|%s|%d|%d\n" "$percent" "$CURRENT_FILE" "$FILE_COVERED" "$FILE_TOTAL" >> "$TMP_FILE"
      fi
      ;;
  esac
done < "$LCOV_FILE"

if [ "$OVERALL_TOTAL" -gt 0 ]; then
  OVERALL_COVERAGE=$(awk "BEGIN { printf \"%.2f\", ($OVERALL_COVERED/$OVERALL_TOTAL)*100 }")
else
  OVERALL_COVERAGE="0.00"
fi

# Write markdown report
{
  echo "# 📈 Code Coverage Report"
  echo
  echo "## 🔧 Commit Info"
  echo "- **Branch**: \`$BRANCH\`"
  echo "- **Commit**: \`$COMMIT\`"
  echo "- **Author**: $AUTHOR"
  echo "- **Date**: $DATE"
  echo "- **Message**: _${MESSAGE}_"
  echo
  echo "---"
  echo
  echo "## 🧵 Workflow Debug Info"
  echo
  echo "| Variable | Value |"
  echo "|----------|-------|"
  for var in SEMAPHORE_GIT_BRANCH SEMAPHORE_GIT_COMMITTER SEMAPHORE_JOB_ID SEMAPHORE_PROJECT_NAME SEMAPHORE_PIPELINE_ID SEMAPHORE_WORKFLOW_ID SEMAPHORE_GIT_SHA SEMAPHORE_GIT_REPO_NAME; do
    val="${!var}"
    echo "| \`$var\` | \`$val\` |"
  done
  echo
  echo "---"
  echo
  echo "## 📝 Changed Files"
  echo
  echo '```diff'
  for file in $CHANGED_FILES; do echo "+ $file"; done
  echo '```'
  echo
  echo "---"
  echo
  echo "## 🔍 Per-File Coverage"
  echo
  echo "| File | Coverage | Visual |"
  echo "|------|----------|--------|"

  sort "$TMP_FILE" | while IFS='|' read -r padded file covered total; do
    percent=$(echo "$padded" | sed 's/^0*//')
    bar_len=20
    filled=$(awk "BEGIN { printf \"%d\", ($percent/100)*$bar_len }")
    empty=$((bar_len - filled))
    filled_bar=$(yes '🟩' | head -n "$filled" | tr -d '\n')
    empty_bar=$(yes '⬜' | head -n "$empty" | tr -d '\n')
    echo "| \`$file\` | $percent% ($covered/$total) | $filled_bar$empty_bar |"
  done

  echo
  echo "---"
  echo
  echo "## 📊 Total Coverage"
  echo "**$OVERALL_COVERED / $OVERALL_TOTAL → $OVERALL_COVERAGE%**"
} > "$OUTPUT_FILE"

rm -f "$TMP_FILE"

echo "✅ Report saved to $OUTPUT_FILE"
The end result if a coverage report that looks like this: